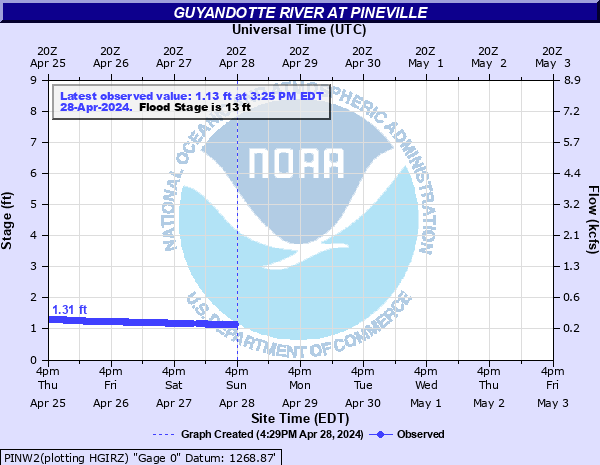
Guyandotte River at Pineville
Critical Stages
11' - Action
13' - Flood
18' - Moderate
20' - Major
Latest Observation
Updated: 2:55 PM EST 12/15/25
Status: No Flooding
Stage: 0.4 ft
Flow: 0.079 kcfs
Forecast
Forecast not available for this location.
| Time | Stage (ft) | Flow (kcfs) |
|---|---|---|
| 2:55 PM 12/15 | 0.4 | 0.079 |
| 2:50 PM 12/15 | 0.4 | 0.079 |
| 2:45 PM 12/15 | 0.4 | 0.079 |
| 2:40 PM 12/15 | 0.4 | 0.079 |
| 2:35 PM 12/15 | 0.4 | 0.079 |
| 2:30 PM 12/15 | 0.4 | 0.079 |
| 2:25 PM 12/15 | 0.4 | 0.079 |
| 2:20 PM 12/15 | 0.4 | 0.079 |
| 2:15 PM 12/15 | 0.4 | 0.079 |
| 2:10 PM 12/15 | 0.4 | 0.079 |
| 2:05 PM 12/15 | 0.4 | 0.079 |
| 2:00 PM 12/15 | 0.4 | 0.079 |
| 1:55 PM 12/15 | 0.4 | 0.079 |
| 1:50 PM 12/15 | 0.41 | 0.0808 |
| 1:45 PM 12/15 | 0.41 | 0.0808 |
| 1:40 PM 12/15 | 0.41 | 0.0808 |
| 1:35 PM 12/15 | 0.41 | 0.0808 |
| 1:30 PM 12/15 | 0.41 | 0.0808 |
| 1:25 PM 12/15 | 0.41 | 0.0808 |
| 1:20 PM 12/15 | 0.41 | 0.0808 |
| 1:15 PM 12/15 | 0.42 | 0.0826 |
| 1:10 PM 12/15 | 0.42 | 0.0826 |
| 1:05 PM 12/15 | 0.42 | 0.0826 |
| 1:00 PM 12/15 | 0.42 | 0.0826 |
| 12:55 PM 12/15 | 0.42 | 0.0826 |
| 12:50 PM 12/15 | 0.42 | 0.0826 |
| 12:45 PM 12/15 | 0.43 | 0.0844 |
| 12:40 PM 12/15 | 0.43 | 0.0844 |
| 12:35 PM 12/15 | 0.43 | 0.0844 |
| 12:30 PM 12/15 | 0.43 | 0.0844 |
23' -
The parking lot and fire house building on the right downstream side of the riverbank near the bridge starts to flood.
22' -
The public swimming pool on the left upstream side of the river next to the bridge starts to flood.
20' -
The bottom of the pineville police department building on right downstream side of the river starts to flood.
18' -
Very serious flooding starts to occur throughout Pineville, mainly in the lower sections along the river and Rockcastle Creek.
13' -
Homes and some businesses along Rockcastle Creek near Pine Aveneue and Main Street start to flood due to backwater from the Guyandotte. Also, some homes start to flood one quarter mile downstream from the river gage near the confluence of the Williams Branch Creek and the Guyandotte River.
| Date | Stage (ft) |
|---|---|
| Jul 8, 2001 | 21.01 |
| Apr 5, 1977 | 17.76 |
| Mar 12, 1963 | 15.25 |
| Jan 29, 1957 | 14.7 |
| Feb 16, 2025 | 14.05 |
| May 16, 1996 | 13.76 |
| Feb 28, 1955 | 13.58 |
| May 9, 2009 | 13.5 |
| May 17, 2001 | 13.2 |
| Mar 6, 1955 | 13.1 |
| Mar 5, 2015 | 12.2 |
| Jun 7, 1981 | 12.04 |
| May 7, 1984 | 12 |
| Feb 26, 1972 | 11.98 |
| Feb 13, 1948 | 11.95 |
| Mar 7, 1967 | 11.75 |
| Feb 2, 1950 | 11.7 |
| Jan 26, 1978 | 11.6 |
| Feb 6, 2020 | 11.5 |
| Feb 11, 2018 | 11.4 |
Data provided by the National Weather Service.