« Back to Hickory Hills Rivers
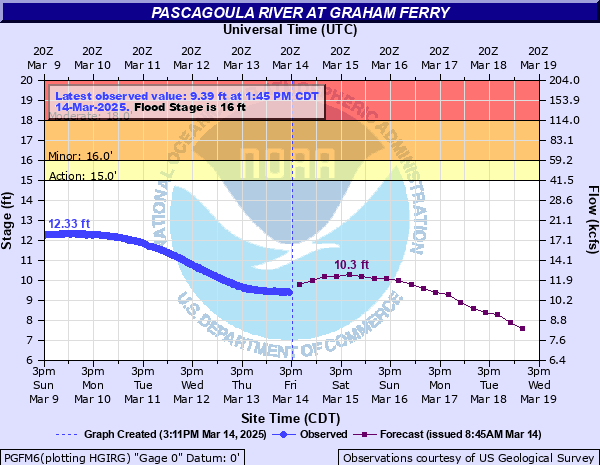
Pascagoula River at Graham Ferry
Critical Stages
15' - Action
16' - Flood
18' - Moderate
20' - Major
Latest Observation
Updated: 12:45 PM CST 12/15/25
Status: No Flooding
Stage: 2.9 ft
Flow: 3.21 kcfs
Forecast
| Time | Stage (ft) | Flow (kcfs) |
|---|---|---|
| 6 PM 12/15 | 2.8 | 3.07 |
| 12 AM 12/16 | 2.9 | 3.21 |
| 6 AM 12/16 | 2.7 | 2.93 |
| 12 PM 12/16 | 2.7 | 2.93 |
| 6 PM 12/16 | 2.7 | 2.93 |
| 12 AM 12/17 | 2.8 | 3.07 |
| 6 AM 12/17 | 2.6 | 2.8 |
| 12 PM 12/17 | 2.6 | 2.8 |
| 6 PM 12/17 | 2.6 | 2.8 |
| 12 AM 12/18 | 2.8 | 3.07 |
| 6 AM 12/18 | 2.6 | 2.8 |
| 12 PM 12/18 | 2.5 | 2.65 |
| 6 PM 12/18 | 2.5 | 2.65 |
| 12 AM 12/19 | 2.7 | 2.93 |
| 6 AM 12/19 | 2.6 | 2.8 |
| 12 PM 12/19 | 2.5 | 2.65 |
| 6 PM 12/19 | 2.5 | 2.65 |
| 12 AM 12/20 | 2.6 | 2.8 |
| 6 AM 12/20 | 2.6 | 2.8 |
| Time | Stage (ft) | Flow (kcfs) |
|---|---|---|
| 1:45 PM 12/15 | 2.91 | 3.22 |
| 1:30 PM 12/15 | 2.9 | 3.21 |
| 1:15 PM 12/15 | 2.9 | 3.21 |
| 1:00 PM 12/15 | 2.89 | 3.19 |
| 12:45 PM 12/15 | 2.9 | 3.21 |
| 12:30 PM 12/15 | 2.89 | 3.19 |
| 12:15 PM 12/15 | 2.9 | 3.21 |
| 12:00 PM 12/15 | 2.85 | 3.14 |
| 11:45 AM 12/15 | 2.87 | 3.17 |
| 11:30 AM 12/15 | 2.89 | 3.19 |
| 11:15 AM 12/15 | 2.89 | 3.19 |
| 11:00 AM 12/15 | 2.89 | 3.19 |
| 10:45 AM 12/15 | 2.89 | 3.19 |
| 10:30 AM 12/15 | 2.88 | 3.18 |
| 10:15 AM 12/15 | 2.88 | 3.18 |
| 10:00 AM 12/15 | 2.87 | 3.17 |
| 9:45 AM 12/15 | 2.88 | 3.18 |
| 9:30 AM 12/15 | 2.85 | 3.14 |
| 9:15 AM 12/15 | 2.88 | 3.18 |
| 9:00 AM 12/15 | 2.88 | 3.18 |
| 7:45 AM 12/15 | 2.88 | 3.18 |
| 7:30 AM 12/15 | 2.92 | 3.24 |
| 7:15 AM 12/15 | 2.93 | 3.25 |
| 7:00 AM 12/15 | 2.94 | 3.26 |
| 6:45 AM 12/15 | 2.95 | 3.28 |
| 6:30 AM 12/15 | 2.95 | 3.28 |
| 6:15 AM 12/15 | 2.96 | 3.29 |
| 6:00 AM 12/15 | 2.92 | 3.24 |
| 5:45 AM 12/15 | 2.98 | 3.32 |
| 5:30 AM 12/15 | 2.98 | 3.32 |
20.1' -
Flood of Record occurred on February 21, 1961. Some homes in the Cumbest Bluff area will flood. Deep water will cover access to river property along the river. Sections of MS Highway 614 will be inundated.
16' -
River property at Cumbest Bluff will be cut off by high water and some river roads will be impassable.
15' -
Lower elevated homes at Cumbest Bluff are threatened. Some river roads will be impassable.
10' -
Access roads to the river will begin to flood.
| Date | Stage (ft) |
|---|---|
| Feb 28, 1961 | 20.1 |
| Mar 17, 2016 | 18.58 |
| Jan 3, 2019 | 18.44 |
| Jun 25, 2017 | 17.82 |
| Apr 4, 2009 | 17.75 |
| Dec 19, 2009 | 17.72 |
| Mar 9, 2001 | 17.56 |
| Sep 5, 2012 | 17.45 |
| Feb 17, 2013 | 17.34 |
| Apr 6, 2005 | 17.02 |
| Jan 13, 1998 | 16.99 |
| Dec 31, 2018 | 16.82 |
| Mar 17, 2011 | 16.81 |
| Mar 27, 2021 | 16.69 |
| Apr 16, 2014 | 16.61 |
| Apr 18, 2021 | 16.61 |
| Mar 19, 1999 | 16.55 |
| Aug 30, 2022 | 16.52 |
| Feb 12, 2010 | 16.4 |
| Mar 2, 2003 | 16.28 |
Data provided by the National Weather Service.