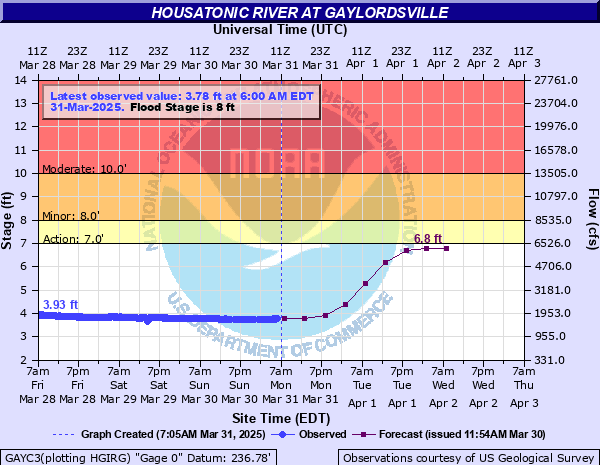
Housatonic River at Gaylordsville
Critical Stages
7' - Action
8' - Flood
10' - Moderate
15' - Major
Latest Observation
Updated: 8:00 AM EST 12/17/25
Status: No Flooding
Stage: 2.19 ft
Flow: 0.487 kcfs
Forecast
| Time | Stage (ft) | Flow (kcfs) |
|---|---|---|
| 1 PM 12/17 | 2.3 | 0.547 |
| 7 PM 12/17 | 2.3 | 0.547 |
| 1 AM 12/18 | 2.3 | 0.547 |
| 7 AM 12/18 | 2.3 | 0.547 |
| 1 PM 12/18 | 2.3 | 0.547 |
| 7 PM 12/18 | 2.3 | 0.547 |
| 1 AM 12/19 | 2.4 | 0.606 |
| 7 AM 12/19 | 2.6 | 0.733 |
| Time | Stage (ft) | Flow (kcfs) |
|---|---|---|
| 8:00 AM 12/17 | 2.19 | 0.487 |
| 7:45 AM 12/17 | 2.19 | 0.487 |
| 7:30 AM 12/17 | 2.21 | 0.497 |
| 7:15 AM 12/17 | 2.21 | 0.497 |
| 7:00 AM 12/17 | 2.21 | 0.497 |
| 6:45 AM 12/17 | 2.2 | 0.492 |
| 6:30 AM 12/17 | 2.2 | 0.492 |
| 6:15 AM 12/17 | 2.2 | 0.492 |
| 6:00 AM 12/17 | 2.2 | 0.492 |
| 5:45 AM 12/17 | 2.2 | 0.492 |
| 5:30 AM 12/17 | 2.21 | 0.497 |
| 5:15 AM 12/17 | 2.27 | 0.53 |
| 5:00 AM 12/17 | 2.3 | 0.547 |
| 4:45 AM 12/17 | 2.32 | 0.559 |
| 4:30 AM 12/17 | 2.32 | 0.559 |
| 4:15 AM 12/17 | 2.33 | 0.564 |
| 4:00 AM 12/17 | 2.35 | 0.576 |
| 3:45 AM 12/17 | 2.38 | 0.594 |
| 3:30 AM 12/17 | 2.38 | 0.594 |
| 3:15 AM 12/17 | 2.39 | 0.6 |
| 3:00 AM 12/17 | 2.39 | 0.6 |
| 2:45 AM 12/17 | 2.4 | 0.606 |
| 2:30 AM 12/17 | 2.41 | 0.612 |
| 2:15 AM 12/17 | 2.43 | 0.624 |
| 2:00 AM 12/17 | 2.44 | 0.63 |
| 1:45 AM 12/17 | 2.45 | 0.637 |
| 1:30 AM 12/17 | 2.46 | 0.643 |
| 1:15 AM 12/17 | 2.47 | 0.649 |
| 1:00 AM 12/17 | 2.48 | 0.655 |
| 12:45 AM 12/17 | 2.49 | 0.662 |
15' -
Major flood stage. Water reaches Route 7 at Boardman Bridge.
14' -
Water reaches the Fedco parking lot and the lower New Milford Foundry.
12' -
Water reaches the generator floor at Bulls Bridge hydroelectric plant.
10' -
Moderate flood stage. In New Milford water reaches Spring Street and US Route 7 at Bridge Street is flooded.
9.5' -
The water reaches businesses on the low side of Spring Street.
8' -
Flood stage. Water reaches New Milford Foundry and Young's Field Road.
7' -
The river is close to bankfull.
| Date | Stage (ft) |
|---|---|
| Aug 19, 1955 | 18.58 |
| May 31, 1984 | 15.22 |
| Jan 1, 1949 | 14.85 |
| Sep 22, 1938 | 14.5 |
| Mar 7, 2011 | 13.75 |
| Apr 17, 2007 | 12.97 |
| Sep 8, 2011 | 12.9 |
| Mar 13, 1936 | 12.6 |
| Aug 29, 2011 | 12.5 |
| Oct 16, 1955 | 12.45 |
| Oct 15, 2005 | 12.24 |
| Mar 7, 1989 | 12 |
| Mar 12, 2011 | 11.71 |
| Mar 19, 1936 | 11.5 |
| Apr 5, 1987 | 11.5 |
| Nov 4, 1927 | 11.5 |
| Mar 15, 1977 | 11.3 |
| Jan 27, 1996 | 11.21 |
| Apr 5, 1960 | 11.17 |
| Oct 30, 1907 | 11.1 |
Data provided by the National Weather Service.