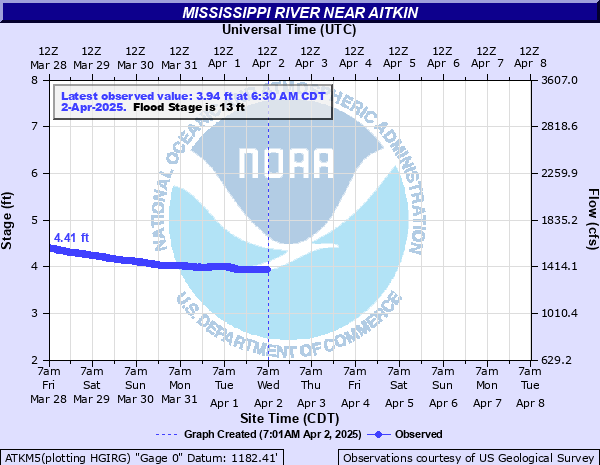
Mississippi River near Aitkin
Critical Stages
12' - Action
13' - Flood
15' - Moderate
18' - Major
Latest Observation
Updated: 8:30 AM CST 12/9/25
Status: No Flooding
Stage: 4.21 ft
Flow: 1.5 kcfs
Forecast
Forecast not available for this location.
| Time | Stage (ft) | Flow (kcfs) |
|---|---|---|
| 9:30 AM 12/9 | 4.22 | 1.51 |
| 9:15 AM 12/9 | 4.22 | 1.51 |
| 9:00 AM 12/9 | 4.21 | 1.5 |
| 8:45 AM 12/9 | 4.21 | 1.5 |
| 8:30 AM 12/9 | 4.21 | 1.5 |
| 8:15 AM 12/9 | 4.21 | 1.5 |
| 8:00 AM 12/9 | 4.21 | 1.5 |
| 7:45 AM 12/9 | 4.21 | 1.5 |
| 7:30 AM 12/9 | 4.21 | 1.5 |
| 7:15 AM 12/9 | 4.21 | 1.5 |
| 7:00 AM 12/9 | 4.21 | 1.5 |
| 6:45 AM 12/9 | 4.2 | 1.5 |
| 6:30 AM 12/9 | 4.21 | 1.5 |
| 6:15 AM 12/9 | 4.2 | 1.5 |
| 6:00 AM 12/9 | 4.2 | 1.5 |
| 5:45 AM 12/9 | 4.2 | 1.5 |
| 5:30 AM 12/9 | 4.2 | 1.5 |
| 5:15 AM 12/9 | 4.2 | 1.5 |
| 5:00 AM 12/9 | 4.2 | 1.5 |
| 4:45 AM 12/9 | 4.2 | 1.5 |
| 4:30 AM 12/9 | 4.2 | 1.5 |
| 4:15 AM 12/9 | 4.2 | 1.5 |
| 4:00 AM 12/9 | 4.2 | 1.5 |
| 3:45 AM 12/9 | 4.2 | 1.5 |
| 3:30 AM 12/9 | 4.2 | 1.5 |
| 3:15 AM 12/9 | 4.19 | 1.49 |
| 3:00 AM 12/9 | 4.2 | 1.5 |
| 2:45 AM 12/9 | 4.2 | 1.5 |
| 2:30 AM 12/9 | 4.19 | 1.49 |
| 2:15 AM 12/9 | 4.19 | 1.49 |
26' -
The BNSF Railroad track becomes impassable.
25' -
The transformer station becomes inoperable.
23.5' -
The power and water plants in Aitkin become inoperative.
21' -
The power plant at Aitkin needs emergency protection.
20.5' -
Portions of Highway 169 northeast of Aitkin become impassable.
19' -
The transformer station needs emergency protection.
18' -
The Aitkin sewage plant becomes inoperative.
17' -
Pumping begins at the wastewater treatment plant. Sandbagging begins at Aitkin city transformer. Water tops the levees on the North side of Aitkin.
15' -
A few homes become surrounded by water in the Cedarbrook neighborhood near Eagle Rd. The Aitkin city park becomes flooded.
13' -
The boat ramp at Aitkin city park floods. A few driveways become covered with water in the Cedarbrook area. Minor flooding of farmland occurs in the Cedarbrook community.
| Date | Stage (ft) |
|---|---|
| May 20, 1950 | 22.49 |
| Jul 6, 1905 | 19.5 |
| Apr 29, 1916 | 19.3 |
| Jun 9, 1944 | 18.8 |
| Apr 27, 1948 | 18.77 |
| May 12, 1938 | 18.7 |
| Jun 28, 2012 | 18.61 |
| Jun 15, 1908 | 18.2 |
| Aug 14, 1953 | 18.13 |
| Apr 26, 1906 | 18 |
| Jun 20, 1943 | 18 |
| May 3, 1975 | 17.95 |
| Apr 28, 2001 | 17.74 |
| May 6, 1954 | 17.73 |
| Apr 22, 1941 | 17.7 |
| Apr 15, 1952 | 17.62 |
| Mar 26, 1945 | 17.51 |
| Apr 25, 2023 | 17.5 |
| Apr 26, 1965 | 17.44 |
| Apr 23, 1969 | 17.28 |
Data provided by the National Weather Service.