Lehigh River at Bethlehem
Critical Stages
12' - Action
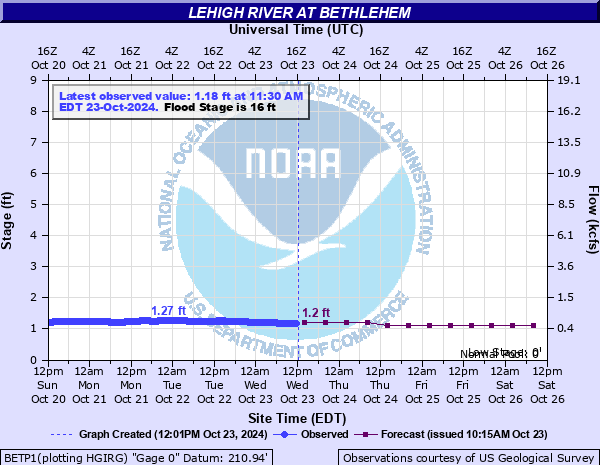
16' - Flood
20' - Moderate
22' - Major
Latest Observation
Updated: 9:30 AM EST 12/6/25
Status: No Flooding
Stage: 1.25 ft
Flow: 0.587 kcfs
Forecast
| Time | Stage (ft) | Flow (kcfs) |
|---|---|---|
| 1 PM 12/6 | 1.3 | 0.633 |
| 7 PM 12/6 | 1.3 | 0.633 |
| 1 AM 12/7 | 1.3 | 0.633 |
| 7 AM 12/7 | 1.3 | 0.633 |
| 1 PM 12/7 | 1.3 | 0.633 |
| 7 PM 12/7 | 1.3 | 0.633 |
| 1 AM 12/8 | 1.3 | 0.633 |
| 7 AM 12/8 | 1.3 | 0.633 |
| Time | Stage (ft) | Flow (kcfs) |
|---|---|---|
| 9:30 AM 12/6 | 1.25 | 0.587 |
| 9:15 AM 12/6 | 1.25 | 0.587 |
| 9:00 AM 12/6 | 1.26 | 0.596 |
| 8:45 AM 12/6 | 1.26 | 0.596 |
| 8:30 AM 12/6 | 1.26 | 0.596 |
| 8:15 AM 12/6 | 1.26 | 0.596 |
| 8:00 AM 12/6 | 1.26 | 0.596 |
| 7:45 AM 12/6 | 1.26 | 0.596 |
| 7:30 AM 12/6 | 1.26 | 0.596 |
| 7:15 AM 12/6 | 1.26 | 0.596 |
| 7:00 AM 12/6 | 1.26 | 0.596 |
| 6:45 AM 12/6 | 1.26 | 0.596 |
| 6:30 AM 12/6 | 1.26 | 0.596 |
| 6:15 AM 12/6 | 1.26 | 0.596 |
| 6:00 AM 12/6 | 1.27 | 0.605 |
| 5:45 AM 12/6 | 1.27 | 0.605 |
| 5:30 AM 12/6 | 1.27 | 0.605 |
| 5:15 AM 12/6 | 1.27 | 0.605 |
| 5:00 AM 12/6 | 1.27 | 0.605 |
| 4:45 AM 12/6 | 1.27 | 0.605 |
| 4:30 AM 12/6 | 1.28 | 0.614 |
| 4:15 AM 12/6 | 1.28 | 0.614 |
| 4:00 AM 12/6 | 1.28 | 0.614 |
| 3:45 AM 12/6 | 1.28 | 0.614 |
| 3:30 AM 12/6 | 1.28 | 0.614 |
| 3:15 AM 12/6 | 1.29 | 0.624 |
| 3:00 AM 12/6 | 1.29 | 0.624 |
| 2:45 AM 12/6 | 1.29 | 0.624 |
| 2:30 AM 12/6 | 1.29 | 0.624 |
| 2:15 AM 12/6 | 1.29 | 0.624 |
25' -
Levees in the Bethleham area are topped. Major flooding begins.
16' -
Wilson Avenue takes on water.
15.5' -
Sand Island Recreational Area in Bethlehem is flooded.
15' -
The islands in the Allentown area begin to flood.
14' -
Flooding begins upstream in Allentown. Backwater begins to effect the Little Lehigh and Jordan creeks.
| Date | Stage (ft) |
|---|---|
| May 23, 1942 | 25.9 |
| Feb 28, 1902 | 24.9 |
| Aug 19, 1955 | 23.38 |
| Jun 23, 1972 | 20.02 |
| Sep 18, 2004 | 19.7 |
| Sep 2, 2021 | 19.53 |
| Aug 24, 1933 | 18.7 |
| Jul 10, 1935 | 18.53 |
| Jun 28, 2006 | 17.74 |
| Mar 11, 2011 | 17.17 |
| Jan 25, 1979 | 17.12 |
| Mar 12, 1936 | 17.04 |
| Jan 20, 1996 | 16.68 |
| Apr 3, 2005 | 16.06 |
| Jan 28, 1996 | 15.57 |
| Dec 5, 1950 | 15.31 |
| Nov 22, 1952 | 13.75 |
| Dec 2, 1996 | 12.72 |
| Aug 28, 2011 | 11.91 |
| Sep 9, 2011 | 11.45 |
Data provided by the National Weather Service.