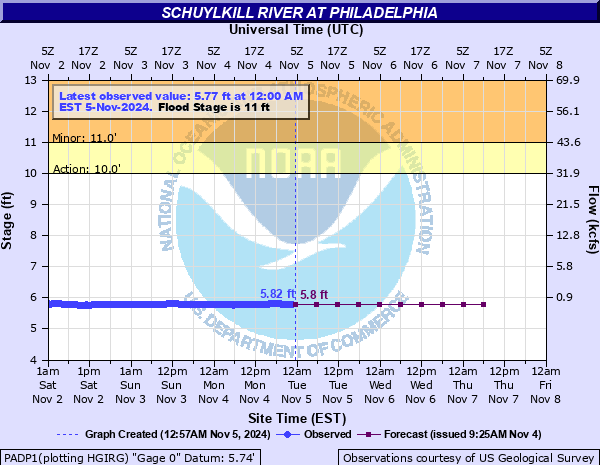
Schuylkill River at Philadelphia
Critical Stages
10' - Action
11' - Flood
13' - Moderate
15.5' - Major
Latest Observation
Updated: 9:00 AM EST 12/6/25
Status: No Flooding
Stage: 5.93 ft
Flow: 0.67 kcfs
Forecast
| Time | Stage (ft) | Flow (kcfs) |
|---|---|---|
| 1 PM 12/6 | 6 | 0.858 |
| 7 PM 12/6 | 6 | 0.858 |
| 1 AM 12/7 | 6 | 0.858 |
| 7 AM 12/7 | 5.9 | 0.602 |
| 1 PM 12/7 | 5.9 | 0.602 |
| 7 PM 12/7 | 5.9 | 0.602 |
| 1 AM 12/8 | 5.9 | 0.602 |
| 7 AM 12/8 | 5.9 | 0.602 |
| Time | Stage (ft) | Flow (kcfs) |
|---|---|---|
| 9:00 AM 12/6 | 5.93 | 0.67 |
| 8:30 AM 12/6 | 5.94 | 0.694 |
| 8:00 AM 12/6 | 5.94 | 0.694 |
| 7:30 AM 12/6 | 5.94 | 0.694 |
| 7:00 AM 12/6 | 5.95 | 0.719 |
| 6:30 AM 12/6 | 5.95 | 0.719 |
| 6:00 AM 12/6 | 5.95 | 0.719 |
| 5:30 AM 12/6 | 5.95 | 0.719 |
| 5:00 AM 12/6 | 5.95 | 0.719 |
| 4:30 AM 12/6 | 5.95 | 0.719 |
| 4:00 AM 12/6 | 5.95 | 0.719 |
| 3:30 AM 12/6 | 5.95 | 0.719 |
| 3:00 AM 12/6 | 5.94 | 0.694 |
| 2:30 AM 12/6 | 5.95 | 0.719 |
| 2:00 AM 12/6 | 5.95 | 0.719 |
| 1:30 AM 12/6 | 5.95 | 0.719 |
| 1:00 AM 12/6 | 5.95 | 0.719 |
| 12:30 AM 12/6 | 5.95 | 0.719 |
| 12:00 AM 12/6 | 5.95 | 0.719 |
| 11:30 PM 12/5 | 5.96 | 0.745 |
| 11:00 PM 12/5 | 5.96 | 0.745 |
| 10:30 PM 12/5 | 5.96 | 0.745 |
| 10:00 PM 12/5 | 5.96 | 0.745 |
| 9:30 PM 12/5 | 5.97 | 0.772 |
| 9:00 PM 12/5 | 5.97 | 0.772 |
| 8:30 PM 12/5 | 5.98 | 0.8 |
| 8:00 PM 12/5 | 5.99 | 0.828 |
| 7:30 PM 12/5 | 5.99 | 0.828 |
| 7:00 PM 12/5 | 5.99 | 0.828 |
| 6:30 PM 12/5 | 5.99 | 0.828 |
16' -
First floor apartments and businesses on Main Street in Manayunk are completely submerged between Shurs Lane and Green Lane. Ridge Avenue floods.
13' -
Main Street in Manayunk is closed from Ridge Avenue to Leverington Street.
12' -
Main Street in Manayunk floods in the area of Shurs Lane.
11.5' -
Route 1 off ramp to Ridge Avenue is flooded and closed. MLK Drive is flooded and closed between Greenland Drive and Montgomery Drive.
11' -
Kelly Drive is flooded and closed between Hunting Park Avenue and Falls Bridge. The Flat Rock area is flooded.
10.4' -
Kelly Drive is flooded and closed between North Ferry Road and Falls Bridge.
| Date | Stage (ft) |
|---|---|
| Oct 4, 1869 | 17 |
| Sep 2, 2021 | 16.35 |
| Mar 1, 1902 | 14.8 |
| Aug 24, 1933 | 14.7 |
| Jun 23, 1972 | 14.65 |
| Jun 2, 1946 | 14.57 |
| Sep 17, 1999 | 14.1 |
| May 1, 2014 | 13.91 |
| Aug 28, 2011 | 13.56 |
| Jan 20, 1996 | 13.36 |
| Sep 13, 1971 | 13.28 |
| Aug 5, 2020 | 13.28 |
| Oct 1, 2010 | 13.1 |
| Jun 28, 2006 | 12.49 |
| Dec 5, 1993 | 12.41 |
| Jan 10, 2024 | 12.13 |
| Oct 9, 2005 | 12.07 |
| Sep 7, 2011 | 12.01 |
| Sep 29, 2004 | 11.86 |
| Dec 18, 2023 | 11.82 |
Data provided by the National Weather Service.