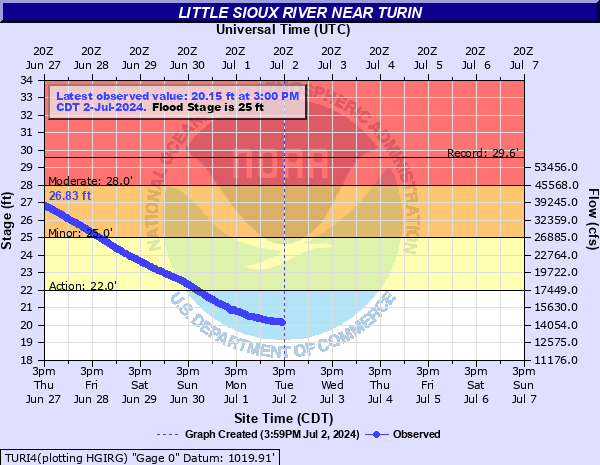
Little Sioux River near Turin
Critical Stages
22' - Action
25' - Flood
28' - Moderate
34.5' - Major
Latest Observation
Updated: 7:00 PM CST 12/15/25
Status: No Flooding
Stage: 8.22 ft
Flow: 1.19 kcfs
Forecast
Forecast not available for this location.
| Time | Stage (ft) | Flow (kcfs) |
|---|---|---|
| 7:00 PM 12/15 | 8.22 | 1.19 |
| 6:45 PM 12/15 | 8.21 | 1.19 |
| 6:30 PM 12/15 | 8.21 | 1.19 |
| 6:15 PM 12/15 | 8.2 | 1.18 |
| 6:00 PM 12/15 | 8.2 | 1.18 |
| 5:45 PM 12/15 | 8.2 | 1.18 |
| 5:30 PM 12/15 | 8.19 | 1.17 |
| 5:15 PM 12/15 | 8.19 | 1.17 |
| 5:00 PM 12/15 | 8.19 | 1.17 |
| 4:45 PM 12/15 | 8.18 | 1.16 |
| 4:30 PM 12/15 | 8.18 | 1.16 |
| 4:15 PM 12/15 | 8.18 | 1.16 |
| 4:00 PM 12/15 | 8.18 | 1.16 |
| 3:45 PM 12/15 | 8.18 | 1.16 |
| 3:30 PM 12/15 | 8.19 | 1.17 |
| 3:15 PM 12/15 | 8.19 | 1.17 |
| 3:00 PM 12/15 | 8.2 | 1.18 |
| 2:45 PM 12/15 | 8.2 | 1.18 |
| 2:30 PM 12/15 | 8.2 | 1.18 |
| 2:15 PM 12/15 | 8.21 | 1.19 |
| 2:00 PM 12/15 | 8.21 | 1.19 |
| 1:45 PM 12/15 | 8.22 | 1.19 |
| 1:30 PM 12/15 | 8.23 | 1.2 |
| 1:15 PM 12/15 | 8.23 | 1.2 |
| 1:00 PM 12/15 | 8.24 | 1.21 |
| 12:45 PM 12/15 | 8.24 | 1.21 |
| 12:30 PM 12/15 | 8.25 | 1.22 |
| 12:15 PM 12/15 | 8.25 | 1.22 |
| 12:00 PM 12/15 | 8.25 | 1.22 |
| 11:45 AM 12/15 | 8.25 | 1.22 |
37' -
Water reaches the bottom of the E54 bridge at the gage site.
34.5' -
Water nears the top of the federal levee.
25' -
Flooding may begin near the mouth of the river downstream of Interstate 29. Upstream of the Interstate the river is contained within the levee system.
22' -
Water exceeds the top of the natural channel but still remains within the confines of the levee system.
| Date | Stage (ft) |
|---|---|
| Mar 15, 2019 | 29.57 |
| Feb 19, 1971 | 27.44 |
| Jun 26, 2024 | 27.37 |
| Jun 22, 1996 | 26.99 |
| Jun 21, 1983 | 26.54 |
| Mar 19, 1978 | 26.47 |
| Apr 8, 1965 | 26.05 |
| May 28, 2013 | 25.44 |
| Mar 30, 1960 | 25.08 |
| Mar 23, 1979 | 24.77 |
| Feb 19, 1994 | 24.76 |
| Jun 30, 2010 | 24.67 |
| Apr 8, 1969 | 24.26 |
| Mar 29, 1962 | 23.97 |
| Jul 19, 1993 | 23.96 |
| Sep 25, 2018 | 23.86 |
| Mar 7, 1983 | 23.72 |
| Jun 2, 1963 | 23.3 |
| Apr 28, 1975 | 23.24 |
| Jun 21, 2014 | 23.08 |
Data provided by the National Weather Service.