Fox River (North) at Appleton
Critical Stages
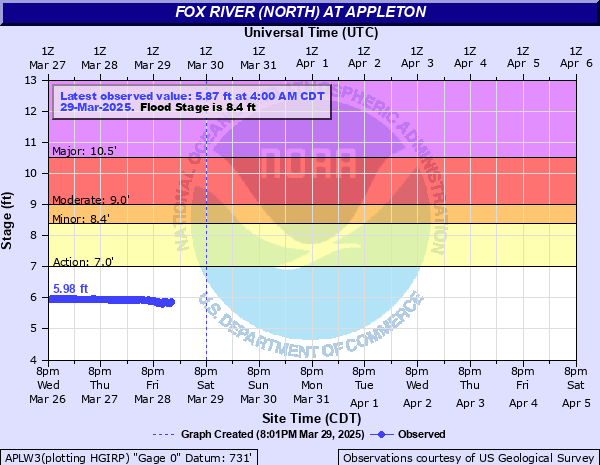
7' - Action
8.4' - Flood
9' - Moderate
10.5' - Major
Latest Observation
Updated: 4:00 AM CST 12/8/25
Status: No Flooding
Stage: 5.74 ft
Flow: 4.44 kcfs
Forecast
Forecast not available for this location.
| Time | Stage (ft) | Flow (kcfs) |
|---|---|---|
| 4:00 AM 12/8 | 5.74 | 4.44 |
| 3:55 AM 12/8 | 5.73 | 4.39 |
| 3:50 AM 12/8 | 5.74 | 4.44 |
| 3:45 AM 12/8 | 5.74 | 4.44 |
| 3:40 AM 12/8 | 5.74 | 4.44 |
| 3:35 AM 12/8 | 5.74 | 4.44 |
| 3:30 AM 12/8 | 5.74 | 4.44 |
| 3:25 AM 12/8 | 5.74 | 4.44 |
| 3:20 AM 12/8 | 5.74 | 4.44 |
| 3:15 AM 12/8 | 5.74 | 4.44 |
| 3:10 AM 12/8 | 5.74 | 4.44 |
| 3:05 AM 12/8 | 5.74 | 4.44 |
| 3:00 AM 12/8 | 5.73 | 4.39 |
| 2:55 AM 12/8 | 5.73 | 4.39 |
| 2:50 AM 12/8 | 5.73 | 4.39 |
| 2:45 AM 12/8 | 5.74 | 4.44 |
| 2:40 AM 12/8 | 5.73 | 4.39 |
| 2:35 AM 12/8 | 5.73 | 4.39 |
| 2:30 AM 12/8 | 5.73 | 4.39 |
| 2:25 AM 12/8 | 5.73 | 4.39 |
| 2:20 AM 12/8 | 5.74 | 4.44 |
| 2:15 AM 12/8 | 5.74 | 4.44 |
| 2:10 AM 12/8 | 5.75 | 4.5 |
| 2:05 AM 12/8 | 5.73 | 4.39 |
| 2:00 AM 12/8 | 5.74 | 4.44 |
| 1:55 AM 12/8 | 5.74 | 4.44 |
| 1:50 AM 12/8 | 5.73 | 4.39 |
| 1:45 AM 12/8 | 5.74 | 4.44 |
| 1:40 AM 12/8 | 5.73 | 4.39 |
| 1:35 AM 12/8 | 5.73 | 4.39 |
10.5' -
Flooding likely affecting structures along Oneida Street and along Vandenberg Lane and Pheasant Run.
9' -
Water flows into Lutz Park affecting recreational facilities. Water current is dangerous at these levels or higher. Water is impacting some structures near Oneida Street and downstream near Wrightstown.
8.4' -
The current is dangerous and lowland flooding is occurring. Water is affecting an apartment complex near Oneida Street and Water Street.
8' -
The water current is fast. Lowland flooding is occurring downstream including the Wrightstown area.
7.5' -
The river current is fast from Appleton to the Thousand Island park downstream. Flooding affects mainly lowland areas downstream to Wrightstown if high flows persist for several days.
7' -
The river current in this region increases significantly from Appleton to The Thousand Island area downstream.
| Date | Stage (ft) |
|---|---|
| Jun 13, 2008 | 8.7 |
| May 12, 2018 | 8.52 |
| Jul 6, 1993 | 8.05 |
| Apr 30, 2011 | 7.94 |
| Jun 17, 2004 | 7.9 |
| Oct 7, 1987 | 7.75 |
| Sep 25, 1986 | 7.7 |
| Apr 3, 2016 | 7.38 |
| Apr 14, 2022 | 6.89 |
Data provided by the National Weather Service.