Wolf River (WI) at Langlade
Critical Stages
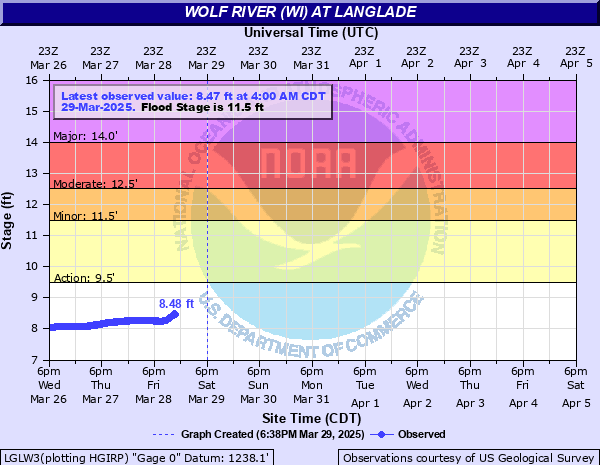
9.5' - Action
11.5' - Flood
12.5' - Moderate
14' - Major
Latest Observation
Updated: 4:00 AM CST 12/8/25
Status: No Flooding
Stage: 7.98 ft
Flow: 0.369 kcfs
Forecast
Forecast not available for this location.
| Time | Stage (ft) | Flow (kcfs) |
|---|---|---|
| 4:00 AM 12/8 | 7.98 | 0.369 |
| 3:45 AM 12/8 | 7.99 | 0.373 |
| 3:30 AM 12/8 | 8 | 0.378 |
| 3:15 AM 12/8 | 8 | 0.378 |
| 3:00 AM 12/8 | 7.99 | 0.373 |
| 2:45 AM 12/8 | 8 | 0.378 |
| 2:30 AM 12/8 | 8 | 0.378 |
| 2:15 AM 12/8 | 7.99 | 0.373 |
| 2:00 AM 12/8 | 7.99 | 0.373 |
| 1:45 AM 12/8 | 7.99 | 0.373 |
| 1:30 AM 12/8 | 8 | 0.378 |
| 1:15 AM 12/8 | 7.99 | 0.373 |
| 1:00 AM 12/8 | 7.99 | 0.373 |
| 12:45 AM 12/8 | 7.99 | 0.373 |
| 12:30 AM 12/8 | 7.99 | 0.373 |
| 12:15 AM 12/8 | 7.99 | 0.373 |
| 12:00 AM 12/8 | 7.98 | 0.369 |
| 11:45 PM 12/7 | 7.98 | 0.369 |
| 11:30 PM 12/7 | 7.98 | 0.369 |
| 11:15 PM 12/7 | 7.97 | 0.364 |
| 11:00 PM 12/7 | 7.98 | 0.369 |
| 10:45 PM 12/7 | 7.97 | 0.364 |
| 10:30 PM 12/7 | 7.98 | 0.369 |
| 10:15 PM 12/7 | 7.97 | 0.364 |
| 10:00 PM 12/7 | 7.97 | 0.364 |
| 9:45 PM 12/7 | 7.97 | 0.364 |
| 9:30 PM 12/7 | 7.97 | 0.364 |
| 9:15 PM 12/7 | 7.97 | 0.364 |
| 9:00 PM 12/7 | 7.97 | 0.364 |
| 8:45 PM 12/7 | 7.96 | 0.36 |
14' -
Water levels may approach the Highway 64 bridge. Highway 64 may be closed and floodwaters may also be approaching Highway 55.
12.5' -
Up to a foot of water surrounds structures near the Highway 64 bridge.
11.5' -
Ice and water may begin to move onshore at locations near the highway 64 bridge.
11.5' -
Ice and water may begin to move onshore at locations near the Highway 64 bridge.
11.5' -
Water approaches the foundation of a small hotel next to the river in the town of Langlade. At high flows, rivers banks become unstable and can erode quickly. Other affects of flooding appear to be confined to wooded land.
9.5' -
There is minor flooding of lowland in the vicinity of the town of Langlade.
8.35' -
Or similar to a flow of around 600 cfs rapids downstream start becoming very active at this stage.
| Date | Stage (ft) |
|---|---|
| Jul 27, 2020 | 11.15 |
| Jan 13, 2016 | 11.1 |
| Apr 26, 1996 | 10.4 |
| Apr 19, 2019 | 10.4 |
| Jun 13, 1990 | 10.02 |
| Apr 6, 1986 | 9.97 |
| Apr 22, 1979 | 9.87 |
| Apr 26, 1997 | 9.85 |
| Jun 20, 1993 | 9.84 |
| Jun 18, 2018 | 9.78 |
| May 4, 2013 | 9.75 |
| Jun 13, 1991 | 9.73 |
| Apr 1, 1998 | 9.67 |
| Mar 16, 2003 | 9.6 |
| Apr 19, 2002 | 9.6 |
| Mar 17, 2016 | 9.56 |
| Apr 21, 1992 | 9.53 |
| Apr 24, 1985 | 9.5 |
| Sep 24, 2010 | 9.33 |
Data provided by the National Weather Service.