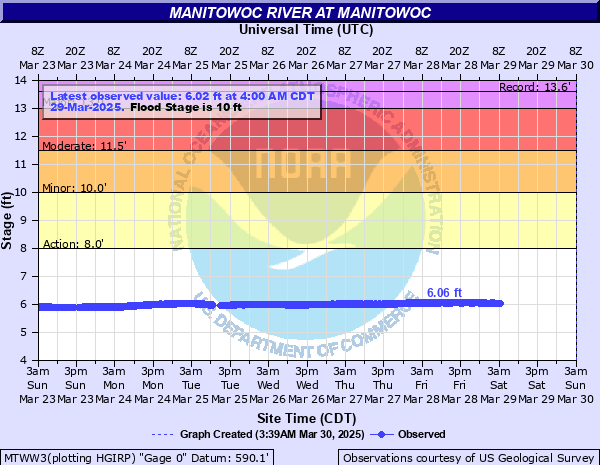
Manitowoc River at Manitowoc
Critical Stages
8' - Action
10' - Flood
11.5' - Moderate
13' - Major
Latest Observation
Updated: 4:00 AM CST 12/8/25
Status: No Flooding
Stage: 4.36 ft
Flow: 0.0658 kcfs
Forecast
Forecast not available for this location.
| Time | Stage (ft) | Flow (kcfs) |
|---|---|---|
| 4:00 AM 12/8 | 4.36 | 0.0658 |
| 3:45 AM 12/8 | 4.36 | 0.0658 |
| 3:30 AM 12/8 | 4.37 | 0.0677 |
| 3:15 AM 12/8 | 4.37 | 0.0677 |
| 3:00 AM 12/8 | 4.36 | 0.0658 |
| 2:45 AM 12/8 | 4.37 | 0.0677 |
| 2:30 AM 12/8 | 4.38 | 0.0698 |
| 2:15 AM 12/8 | 4.37 | 0.0677 |
| 2:00 AM 12/8 | 4.38 | 0.0698 |
| 1:45 AM 12/8 | 4.38 | 0.0698 |
| 1:30 AM 12/8 | 4.38 | 0.0698 |
| 1:15 AM 12/8 | 4.38 | 0.0698 |
| 1:00 AM 12/8 | 4.37 | 0.0677 |
| 12:45 AM 12/8 | 4.38 | 0.0698 |
| 12:30 AM 12/8 | 4.38 | 0.0698 |
| 12:15 AM 12/8 | 4.37 | 0.0677 |
| 12:00 AM 12/8 | 4.37 | 0.0677 |
| 11:45 PM 12/7 | 4.37 | 0.0677 |
| 11:30 PM 12/7 | 4.38 | 0.0698 |
| 11:15 PM 12/7 | 4.37 | 0.0677 |
| 11:00 PM 12/7 | 4.38 | 0.0698 |
| 10:45 PM 12/7 | 4.37 | 0.0677 |
| 10:30 PM 12/7 | 4.38 | 0.0698 |
| 10:15 PM 12/7 | 4.37 | 0.0677 |
| 10:00 PM 12/7 | 4.37 | 0.0677 |
| 9:45 PM 12/7 | 4.37 | 0.0677 |
| 9:30 PM 12/7 | 4.38 | 0.0698 |
| 9:15 PM 12/7 | 4.37 | 0.0677 |
| 9:00 PM 12/7 | 4.37 | 0.0677 |
| 8:45 PM 12/7 | 4.37 | 0.0677 |
14' -
Flooding affects spread into locations near the river from Archer Street to Ellis Street. Several feet of floodwater covers Broadway Steet and Mills Street.
12' -
Up to 2 feet of water may be covering portions of Clay Pit Road and Broadway Street Park Road in the city of Manitowoc. Parts of Mill Road and North Rapids Road is covered by up to a foot of water.
11' -
Up to a foot of water is covering portions of Clay Pit Road and Broadway Street Park Road. Widespread lowland flooding is occurring.
10' -
There is widespread flooding of lowland and agricultural land. After ice out...the river current is strong from Manitowoc upstream to Clark Mills.
10' -
There is widespread flooding of lowland and agricultural land.
9' -
The river current, after ice out, is likely very fast from just west of Manitowoc upstream to Clark Mills.
8' -
There is minor lowland flooding.
| Date | Stage (ft) |
|---|---|
| Mar 15, 2019 | 13.6 |
| Mar 25, 1986 | 13.3 |
| Mar 31, 1979 | 13.24 |
| Mar 13, 2007 | 12.38 |
| Jun 13, 2008 | 12.04 |
| May 4, 2018 | 11.59 |
| Apr 10, 2013 | 11.19 |
| Mar 27, 1989 | 11.13 |
| Mar 6, 1992 | 11.09 |
| Mar 19, 2011 | 11.06 |
| Mar 26, 2008 | 10.5 |
| Jun 1, 2004 | 10.45 |
| Mar 27, 1976 | 10.42 |
| Mar 7, 1994 | 10.39 |
| Apr 16, 1993 | 10.27 |
| Mar 22, 1975 | 10.19 |
| Apr 14, 2014 | 10.12 |
| Mar 20, 2020 | 10.12 |
| Mar 5, 2022 | 10.1 |
| Jun 23, 2017 | 9.98 |
Data provided by the National Weather Service.