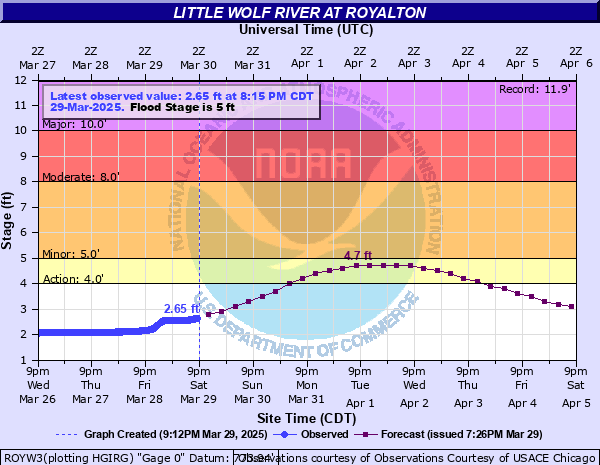
Little Wolf River at Royalton
Critical Stages
4' - Action
5' - Flood
8' - Moderate
10' - Major
Latest Observation
Updated: 4:15 AM CST 12/8/25
Status: No Flooding
Stage: 1.68 ft
Flow: 0.416 kcfs
Forecast
Forecast not available for this location.
| Time | Stage (ft) | Flow (kcfs) |
|---|---|---|
| 4:15 AM 12/8 | 1.68 | 0.416 |
| 4:00 AM 12/8 | 1.67 | 0.411 |
| 3:45 AM 12/8 | 1.66 | 0.406 |
| 3:30 AM 12/8 | 1.66 | 0.406 |
| 3:15 AM 12/8 | 1.65 | 0.401 |
| 3:00 AM 12/8 | 1.65 | 0.401 |
| 2:45 AM 12/8 | 1.64 | 0.395 |
| 2:30 AM 12/8 | 1.64 | 0.395 |
| 2:15 AM 12/8 | 1.64 | 0.395 |
| 2:00 AM 12/8 | 1.63 | 0.39 |
| 1:45 AM 12/8 | 1.63 | 0.39 |
| 1:30 AM 12/8 | 1.62 | 0.385 |
| 1:15 AM 12/8 | 1.62 | 0.385 |
| 1:00 AM 12/8 | 1.61 | 0.38 |
| 12:45 AM 12/8 | 1.61 | 0.38 |
| 12:30 AM 12/8 | 1.61 | 0.38 |
| 12:15 AM 12/8 | 1.61 | 0.38 |
| 12:00 AM 12/8 | 1.6 | 0.375 |
| 11:45 PM 12/7 | 1.6 | 0.375 |
| 11:30 PM 12/7 | 1.6 | 0.375 |
| 11:15 PM 12/7 | 1.59 | 0.37 |
| 11:00 PM 12/7 | 1.59 | 0.37 |
| 10:45 PM 12/7 | 1.59 | 0.37 |
| 10:30 PM 12/7 | 1.58 | 0.365 |
| 10:15 PM 12/7 | 1.58 | 0.365 |
| 10:00 PM 12/7 | 1.58 | 0.365 |
| 9:45 PM 12/7 | 1.57 | 0.36 |
| 9:30 PM 12/7 | 1.56 | 0.355 |
| 9:15 PM 12/7 | 1.56 | 0.355 |
| 9:00 PM 12/7 | 1.56 | 0.355 |
8.5' -
Several feet of water is surrounding buildings and structures downstream of Royalton adjacent to the river.
7' -
Water touches the base of the river gauge station in Royalton. The riverbanks in the area are steep-sided and most homes and roads are situated well above flood stage. Up to 2 feet of flood waters may be surrounding structures downstream between Royalton and New London.
6' -
Water may be surrounding some homes and structures in low-lying areas downstream between Royalton and west of New London.
5' -
Flooding is confined to lowland areas adjacent to the river from Royalton to west of New London.
4' -
There is minor lowland flooding.
| Date | Stage (ft) |
|---|---|
| Mar 28, 1950 | 11.95 |
| Mar 25, 1939 | 10.5 |
| Mar 30, 1916 | 10 |
| Mar 15, 1946 | 9.21 |
| Apr 5, 1959 | 9.1 |
| Mar 26, 1917 | 8.5 |
| Mar 24, 1928 | 8 |
| Mar 3, 1943 | 8 |
| Mar 30, 1943 | 8 |
| Mar 21, 1948 | 7.93 |
| Mar 22, 1935 | 7.82 |
| Mar 26, 1963 | 7.78 |
| Jun 7, 1914 | 7.6 |
| Apr 5, 1956 | 7.1 |
| Apr 2, 1952 | 7 |
| Apr 11, 1922 | 7 |
| Mar 18, 1929 | 7 |
| Jun 1, 1970 | 6.8 |
| Mar 13, 1990 | 6.61 |
| Mar 17, 1945 | 6.5 |
Data provided by the National Weather Service.