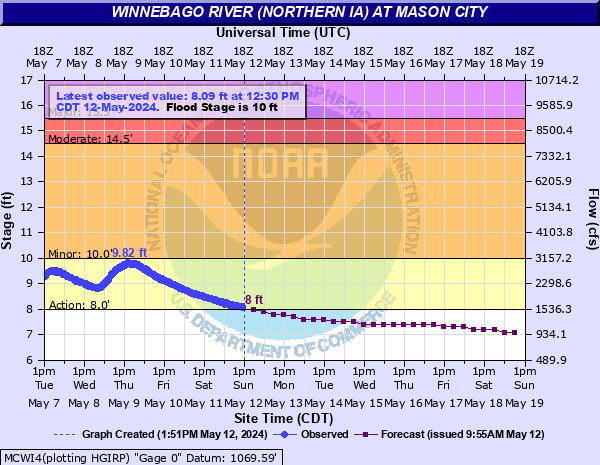
Winnebago River at Mason City
Critical Stages
8' - Action
10' - Flood
14.5' - Moderate
15.5' - Major
Latest Observation
Updated: 11:45 PM CST 12/14/25
Status: No Flooding
Stage: 5.29 ft
Flow: 0.332 kcfs
Forecast
Forecast not available for this location.
| Time | Stage (ft) | Flow (kcfs) |
|---|---|---|
| 12:00 AM 12/15 | 5.28 | 0.329 |
| 11:45 PM 12/14 | 5.29 | 0.332 |
| 11:30 PM 12/14 | 5.29 | 0.332 |
| 11:15 PM 12/14 | 5.29 | 0.332 |
| 11:00 PM 12/14 | 5.3 | 0.335 |
| 10:45 PM 12/14 | 5.3 | 0.335 |
| 10:30 PM 12/14 | 5.29 | 0.332 |
| 10:15 PM 12/14 | 5.3 | 0.335 |
| 10:00 PM 12/14 | 5.3 | 0.335 |
| 9:45 PM 12/14 | 5.29 | 0.332 |
| 9:30 PM 12/14 | 5.3 | 0.335 |
| 9:15 PM 12/14 | 5.3 | 0.335 |
| 9:00 PM 12/14 | 5.3 | 0.335 |
| 8:45 PM 12/14 | 5.29 | 0.332 |
| 8:30 PM 12/14 | 5.29 | 0.332 |
| 8:15 PM 12/14 | 5.29 | 0.332 |
| 8:00 PM 12/14 | 5.29 | 0.332 |
| 7:45 PM 12/14 | 5.3 | 0.335 |
| 7:30 PM 12/14 | 5.3 | 0.335 |
| 7:15 PM 12/14 | 5.29 | 0.332 |
| 7:00 PM 12/14 | 5.29 | 0.332 |
| 6:45 PM 12/14 | 5.29 | 0.332 |
| 6:30 PM 12/14 | 5.29 | 0.332 |
| 6:15 PM 12/14 | 5.28 | 0.329 |
| 6:00 PM 12/14 | 5.28 | 0.329 |
| 5:45 PM 12/14 | 5.27 | 0.326 |
| 5:30 PM 12/14 | 5.27 | 0.326 |
| 5:15 PM 12/14 | 5.26 | 0.323 |
| 5:00 PM 12/14 | 5.25 | 0.32 |
| 4:45 PM 12/14 | 5.26 | 0.323 |
20.5' -
Water affects the floodwall at the water treatment plant located at 13th St NE.
17.4' -
Water reaches bottom of railroad bridge east of Kentucky Ave bridge.
15' -
This is the approximate top of levee protection. Levees run from the 12th St NE bridge to 9th St along the east bank and also from 8th St to 6th St and Hampshire St.
14' -
Water may flow over the city dikes.
12' -
Widespread flooding occurs along the river. Some backwater effects are possible along Willow Creek between downtown Mason City and the confluence with the Winnebago river.
11' -
Sandbagging occurs on the dike from 12th St NE to Carolina St.
10' -
Widespread flooding occurs at city parks. Water reaches the underside of the 12th St NE bridge at the piers.
8' -
Water affects east and west city parks in the 12th St NE area.
7' -
Water affects low-lying areas along the river.
| Date | Stage (ft) |
|---|---|
| Jun 8, 2008 | 18.74 |
| Mar 30, 1933 | 15.7 |
| Mar 27, 1961 | 14.8 |
| May 22, 2004 | 14.67 |
| Apr 11, 1965 | 14.27 |
| Sep 22, 2016 | 14.07 |
| Aug 31, 1962 | 13.06 |
| Apr 1, 1993 | 12.59 |
| Apr 7, 1951 | 12.44 |
| Jul 8, 1969 | 12.25 |
| Jun 12, 1944 | 12.2 |
| Sep 21, 2018 | 12.17 |
| Jun 8, 1984 | 11.94 |
| Jun 21, 1954 | 11.85 |
| Jul 21, 1999 | 11.84 |
| Apr 12, 2001 | 11.83 |
| May 30, 1980 | 11.66 |
| May 18, 1991 | 11.58 |
| Aug 23, 1979 | 11.33 |
| Feb 27, 2023 | 11.24 |
Data provided by the National Weather Service.