Middle Fork Zumbro River at Pine Island
Critical Stages
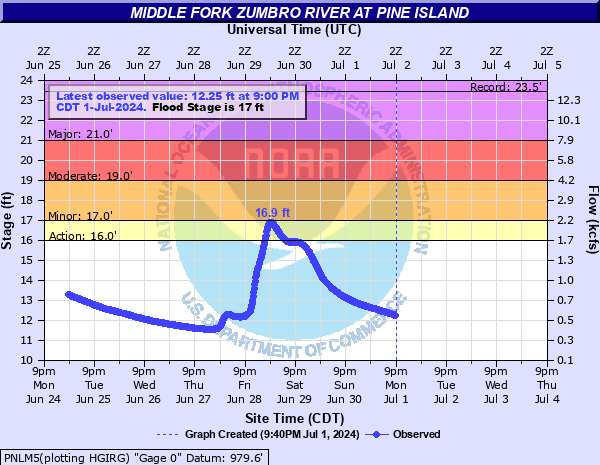
16' - Action
17' - Flood
19' - Moderate
21' - Major
Latest Observation
Updated: 12:00 AM CST 12/15/25
Status: No Flooding
Stage: 9.13 ft
Flow: 0.0443 kcfs
Forecast
Forecast not available for this location.
| Time | Stage (ft) | Flow (kcfs) |
|---|---|---|
| 12:00 AM 12/15 | 9.13 | 0.0443 |
| 11:45 PM 12/14 | 9.13 | 0.0443 |
| 11:30 PM 12/14 | 9.14 | 0.045 |
| 11:15 PM 12/14 | 9.14 | 0.045 |
| 11:00 PM 12/14 | 9.13 | 0.0443 |
| 10:45 PM 12/14 | 9.14 | 0.045 |
| 10:30 PM 12/14 | 9.13 | 0.0443 |
| 10:15 PM 12/14 | 9.14 | 0.045 |
| 10:00 PM 12/14 | 9.14 | 0.045 |
| 9:45 PM 12/14 | 9.13 | 0.0443 |
| 9:30 PM 12/14 | 9.13 | 0.0443 |
| 9:15 PM 12/14 | 9.13 | 0.0443 |
| 9:00 PM 12/14 | 9.13 | 0.0443 |
| 8:45 PM 12/14 | 9.13 | 0.0443 |
| 8:30 PM 12/14 | 9.13 | 0.0443 |
| 8:15 PM 12/14 | 9.13 | 0.0443 |
| 8:00 PM 12/14 | 9.13 | 0.0443 |
| 7:45 PM 12/14 | 9.13 | 0.0443 |
| 7:30 PM 12/14 | 9.13 | 0.0443 |
| 7:15 PM 12/14 | 9.13 | 0.0443 |
| 7:00 PM 12/14 | 9.13 | 0.0443 |
| 6:45 PM 12/14 | 9.13 | 0.0443 |
| 6:30 PM 12/14 | 9.13 | 0.0443 |
| 6:15 PM 12/14 | 9.12 | 0.0435 |
| 6:00 PM 12/14 | 9.12 | 0.0435 |
| 5:45 PM 12/14 | 9.12 | 0.0435 |
| 5:30 PM 12/14 | 9.12 | 0.0435 |
| 5:15 PM 12/14 | 9.12 | 0.0435 |
| 5:00 PM 12/14 | 9.12 | 0.0435 |
| 4:45 PM 12/14 | 9.12 | 0.0435 |
27' -
Flooding occurs at the intersection of 8th St SE and New Haven Rd NW.
26' -
County Rd 3 begins to flood just north of the bridge.
24' -
Flood waters reach the shoulder of County Rd 3 just south of the bridge.
22.5' -
Extensive flooding to multiple homes along Lillie Ln SE and Roder Dr SE.
22' -
Multiple homes along 4th St SE and 5th St SE begin to flood as water rises above the earthen levee at this level.
20.5' -
Some homes along the east side of Rodeo Dr. begin to flood. 8th SE near Nature Preserve Park begins to flood.
19' -
Flood waters enter backyards of properties along Lillie Ln SE.
17.5' -
River Fields parking lot begins to flood as well as the walking path near the baseball fields. Z Trail Park is fully inundated.
16' -
Z Trail Park begins to flood at this level.
15' -
Agricultural land begins to flood to the southwest of the County Rd 3 bridge.
12.5' -
Low lying areas of Nature Preserve Park begin to flood.
| Date | Stage (ft) |
|---|---|
| Sep 23, 2010 | 23.45 |
| Jun 28, 2019 | 21.61 |
| Jun 12, 2008 | 20.24 |
| Oct 1, 2007 | 20.2 |
| Jun 22, 2024 | 18.84 |
| Mar 15, 2019 | 18.27 |
| Mar 31, 2013 | 18.1 |
| Mar 23, 2011 | 17.34 |
| Jun 18, 2014 | 17.27 |
| Apr 1, 2023 | 17.21 |
| May 6, 2013 | 16.77 |
| May 18, 2020 | 16.25 |
| May 12, 2022 | 15.86 |
| Jun 22, 2012 | 14.73 |
| Jun 16, 2012 | 14.48 |
| Jun 12, 2015 | 13.29 |
| Mar 25, 2021 | 11.88 |
Data provided by the National Weather Service.