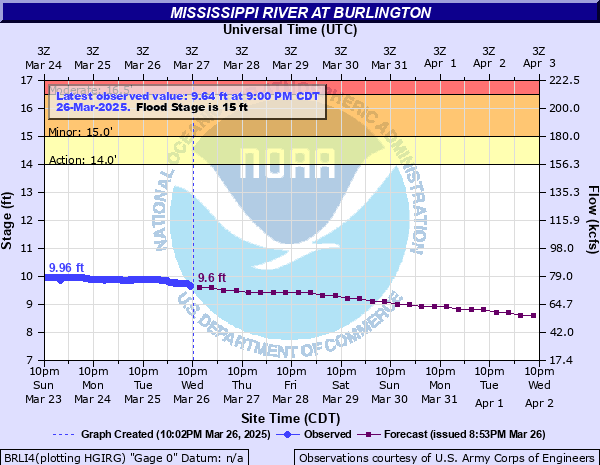
Mississippi River at Burlington
Critical Stages
14' - Action
15' - Flood
16.5' - Moderate
18' - Major
Latest Observation
Updated: 4:00 PM CST 12/15/25
Status: No Flooding
Stage: 7.96 ft
Flow: 41 kcfs
Forecast
| Time | Stage (ft) | Flow (kcfs) |
|---|---|---|
| 6 PM 12/15 | 8 | 42 |
| 12 AM 12/16 | 8 | 42 |
| 6 AM 12/16 | 8 | 42 |
| 12 PM 12/16 | 8 | 42 |
| 6 PM 12/16 | 8 | 42 |
| 12 AM 12/17 | 7.9 | 39.5 |
| 6 AM 12/17 | 7.9 | 39.5 |
| 12 PM 12/17 | 7.9 | 39.5 |
| 6 PM 12/17 | 7.9 | 39.5 |
| 12 AM 12/18 | 7.9 | 39.5 |
| 6 AM 12/18 | 7.9 | 39.5 |
| 12 PM 12/18 | 7.9 | 39.5 |
| 6 PM 12/18 | 7.9 | 39.5 |
| 12 AM 12/19 | 7.9 | 39.5 |
| 6 AM 12/19 | 7.9 | 39.5 |
| 12 PM 12/19 | 7.9 | 39.5 |
| 6 PM 12/19 | 7.9 | 39.5 |
| 12 AM 12/20 | 7.9 | 39.5 |
| 6 AM 12/20 | 7.9 | 39.5 |
| 12 PM 12/20 | 7.9 | 39.5 |
| 6 PM 12/20 | 7.9 | 39.5 |
| 12 AM 12/21 | 7.9 | 39.5 |
| 6 AM 12/21 | 7.9 | 39.5 |
| 12 PM 12/21 | 7.9 | 39.5 |
| 6 PM 12/21 | 7.8 | 37.1 |
| 12 AM 12/22 | 7.8 | 37.1 |
| 6 AM 12/22 | 7.8 | 37.1 |
| Time | Stage (ft) | Flow (kcfs) |
|---|---|---|
| 5:00 PM 12/15 | 7.96 | 41 |
| 4:45 PM 12/15 | 7.96 | 41 |
| 4:30 PM 12/15 | 7.96 | 41 |
| 4:15 PM 12/15 | 7.96 | 41 |
| 4:00 PM 12/15 | 7.96 | 41 |
| 3:45 PM 12/15 | 7.96 | 41 |
| 3:30 PM 12/15 | 7.95 | 40.7 |
| 3:15 PM 12/15 | 7.95 | 40.7 |
| 3:00 PM 12/15 | 7.95 | 40.7 |
| 2:45 PM 12/15 | 7.95 | 40.7 |
| 2:30 PM 12/15 | 7.94 | 40.5 |
| 2:15 PM 12/15 | 7.94 | 40.5 |
| 2:00 PM 12/15 | 7.94 | 40.5 |
| 1:45 PM 12/15 | 7.94 | 40.5 |
| 1:30 PM 12/15 | 7.94 | 40.5 |
| 1:15 PM 12/15 | 7.94 | 40.5 |
| 1:00 PM 12/15 | 7.94 | 40.5 |
| 12:45 PM 12/15 | 7.94 | 40.5 |
| 12:30 PM 12/15 | 7.94 | 40.5 |
| 12:15 PM 12/15 | 7.94 | 40.5 |
| 12:00 PM 12/15 | 7.95 | 40.7 |
| 11:45 AM 12/15 | 7.95 | 40.7 |
| 11:30 AM 12/15 | 7.96 | 41 |
| 11:15 AM 12/15 | 7.96 | 41 |
| 11:00 AM 12/15 | 7.96 | 41 |
| 10:45 AM 12/15 | 7.97 | 41.2 |
| 10:30 AM 12/15 | 7.97 | 41.2 |
| 10:15 AM 12/15 | 7.97 | 41.2 |
| 10:00 AM 12/15 | 7.98 | 41.5 |
| 9:45 AM 12/15 | 7.98 | 41.5 |
28' -
Water reaches the top of the levee that protects industry at the north end of Burlington.
26.5' -
Water affects Main Street in Burlington.
26' -
Water reaches the top of the Gulfport town levee.
23.9' -
Water is in the Burlington Post Office lot. Water is also where the ramp starts at a bank. Water also reaches the top of the number 1 and 2 Henderson levees.
23.5' -
Water also affects Main at Division.
23' -
Water affects the Port of Burlington and Front Street businesses in Burlington.
22.6' -
Water affects the Burlington water treatment plant.
22.5' -
Water reaches Port of Burlington. Water also affects sewer lines on Front Street and other areas downtown.
22' -
Water reaches the first floor of the interior of Port of Burlington. Water also gets on Front Street.
21.5' -
Water reaches the tracks for the Burlington Jct railroad. Water also affects Illinois Highway 96 between Niota and Dallas City.
21' -
Water affects the floor of the lift station at Market Street. Water also reaches the top of the railroad tracks for the BNSF railroad.
20.5' -
Water affects several homes on First Street in Dallas City. Carman Road Blacktop is affected by floodwaters. Water also reaches the top of the Niota town levee.
20' -
Water reaches the front steps of the Burlington Municipal Auditorium and affects the parking lot. Water affects industries at the south end of town. Water affects most of Riverview Park in Fort Madison.
19.5' -
Water affects the Port of Burlington. Water affects residences on First Street in Dallas City. Water also affects several homes in Pontoosuc.
19' -
Water causes drive and access problems to a restaurant along the river. Water also goes over the new seawall on the riverfront. Water affects streets bordering the river in Pontoosuc.
18.5' -
Water is over the bank south of the Burlington auditorium. Water also reaches the base of Old Fort Madison.
18' -
Water affects the Burlington Auditorium parking lot. Water also affects Bluff Harbor Marina. Water affects North Shore Marina in Fort Madison. In Dallas City, water affects First Street at the ball park.
17.5' -
Water affects Riverview Drive in Riverview Park in Fort Madison.
17' -
Water affects the Port of Burlington parking lot.
16' -
Water affects low lying buildings and homes in Montrose and Niota.
15' -
Agricultural flooding occurs.
14' -
Water covers Cabin Road in Gulfport.
13.5' -
Water affects Sullivan Slough Road south of Burlington.
| Date | Stage (ft) |
|---|---|
| Jun 17, 2008 | 25.73 |
| Jul 10, 1993 | 25.1 |
| Jun 2, 2019 | 24.47 |
| Jul 6, 2014 | 23.65 |
| May 3, 2019 | 23.54 |
| May 14, 2001 | 21.82 |
| Apr 25, 1973 | 21.5 |
| May 2, 2008 | 21.18 |
| Apr 30, 1965 | 21 |
| Mar 25, 2019 | 20.51 |
| Jul 12, 2024 | 20.48 |
| Apr 10, 2019 | 20.41 |
| Apr 25, 1993 | 20.4 |
| Jun 6, 2013 | 20.35 |
| Apr 24, 2011 | 20.24 |
| May 4, 2023 | 20 |
| Jul 3, 2013 | 19.92 |
| Oct 6, 1986 | 19.02 |
| Apr 21, 1997 | 18.94 |
| Oct 3, 2016 | 18.93 |
Data provided by the National Weather Service.