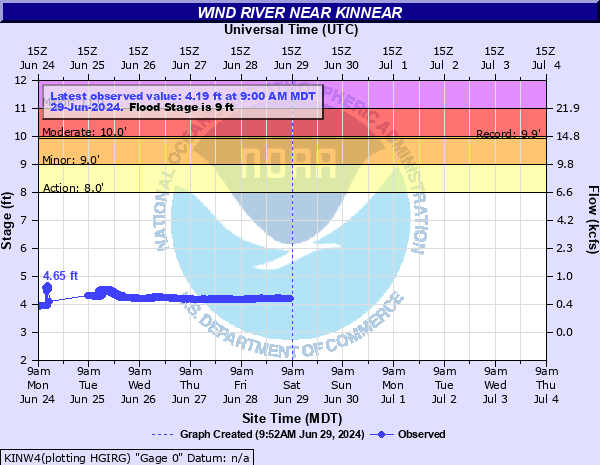
Wind River near Kinnear
Critical Stages
8' - Action
9' - Flood
10' - Moderate
11' - Major
Latest Observation
Updated: 6:00 PM MST 12/15/25
Status: No Flooding
Stage: 3.6 ft
Flow: 0.323 kcfs
Forecast
Forecast not available for this location.
| Time | Stage (ft) | Flow (kcfs) |
|---|---|---|
| 6:00 PM 12/15 | 3.6 | 0.323 |
| 5:45 PM 12/15 | 3.6 | 0.323 |
| 5:30 PM 12/15 | 3.6 | 0.323 |
| 5:15 PM 12/15 | 3.61 | 0.327 |
| 5:00 PM 12/15 | 3.6 | 0.323 |
| 4:45 PM 12/15 | 3.61 | 0.327 |
| 4:30 PM 12/15 | 3.6 | 0.323 |
| 4:15 PM 12/15 | 3.6 | 0.323 |
| 4:00 PM 12/15 | 3.61 | 0.327 |
| 3:45 PM 12/15 | 3.6 | 0.323 |
| 3:30 PM 12/15 | 3.6 | 0.323 |
| 3:15 PM 12/15 | 3.58 | 0.315 |
| 3:00 PM 12/15 | 3.6 | 0.323 |
| 2:45 PM 12/15 | 3.6 | 0.323 |
| 2:30 PM 12/15 | 3.6 | 0.323 |
| 2:15 PM 12/15 | 3.59 | 0.319 |
| 2:00 PM 12/15 | 3.61 | 0.327 |
| 1:45 PM 12/15 | 3.61 | 0.327 |
| 1:30 PM 12/15 | 3.61 | 0.327 |
| 1:15 PM 12/15 | 3.6 | 0.323 |
| 1:00 PM 12/15 | 3.62 | 0.331 |
| 12:45 PM 12/15 | 3.61 | 0.327 |
| 12:30 PM 12/15 | 3.6 | 0.323 |
| 12:15 PM 12/15 | 3.59 | 0.319 |
| 12:00 PM 12/15 | 3.63 | 0.335 |
| 11:45 AM 12/15 | 3.62 | 0.331 |
| 11:30 AM 12/15 | 3.61 | 0.327 |
| 11:15 AM 12/15 | 3.62 | 0.331 |
| 11:00 AM 12/15 | 3.63 | 0.335 |
| 10:45 AM 12/15 | 3.63 | 0.321 |
9.92' -
Record stage and flow---16,600 cfs (7/1/2011).
9' -
Flood stage. Agricultural flooding along both banks becomes more widespread and intensifies. Water begins to encroach the north end of Highway 132.
8' -
Bankfull stage. Minor agricultural flooding along right bank. Water begins to move towards low areas north of Highway 132.
| Date | Stage (ft) |
|---|---|
| Jul 1, 2011 | 9.92 |
| Jun 8, 2017 | 9.73 |
| Jun 19, 2018 | 9.44 |
| Jun 10, 1997 | 8.97 |
| Jun 11, 2015 | 8.95 |
| Jun 1, 2018 | 8.91 |
| Jun 18, 1999 | 8.72 |
| Jun 9, 2010 | 8.71 |
| May 30, 2014 | 8.58 |
| Jun 15, 2019 | 8.42 |
| Jun 16, 1995 | 8.4 |
| Jun 30, 2020 | 8.37 |
| Jun 2, 2015 | 8.29 |
| Jun 11, 2016 | 8.06 |
| Jun 13, 1991 | 8.03 |
| Jun 27, 2009 | 7.89 |
| Jun 27, 2014 | 7.76 |
| Jun 23, 2005 | 7.74 |
| Jul 3, 1998 | 7.72 |
| Jun 6, 2021 | 7.49 |
Data provided by the National Weather Service.