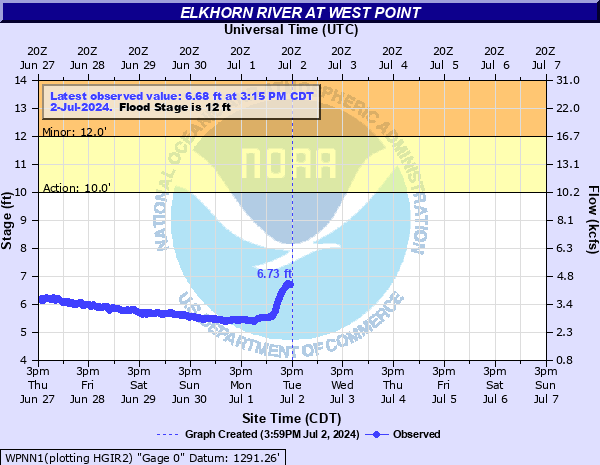
Elkhorn River at West Point
Critical Stages
10' - Action
12' - Flood
16' - Moderate
17' - Major
Latest Observation
Updated: 12:15 AM CST 12/16/25
Status: No Flooding
Stage: 4.16 ft
Flow: 0.803 kcfs
Forecast
Forecast not available for this location.
| Time | Stage (ft) | Flow (kcfs) |
|---|---|---|
| 1:15 AM 12/16 | 4.15 | 0.794 |
| 1:00 AM 12/16 | 4.16 | 0.803 |
| 12:45 AM 12/16 | 4.16 | 0.803 |
| 12:30 AM 12/16 | 4.16 | 0.803 |
| 12:15 AM 12/16 | 4.16 | 0.803 |
| 12:00 AM 12/16 | 4.17 | 0.811 |
| 11:45 PM 12/15 | 4.17 | 0.811 |
| 11:30 PM 12/15 | 4.17 | 0.811 |
| 11:15 PM 12/15 | 4.18 | 0.82 |
| 11:00 PM 12/15 | 4.18 | 0.82 |
| 10:45 PM 12/15 | 4.19 | 0.829 |
| 10:30 PM 12/15 | 4.19 | 0.829 |
| 10:15 PM 12/15 | 4.19 | 0.829 |
| 10:00 PM 12/15 | 4.2 | 0.838 |
| 9:45 PM 12/15 | 4.2 | 0.838 |
| 9:30 PM 12/15 | 4.2 | 0.838 |
| 9:15 PM 12/15 | 4.21 | 0.846 |
| 9:00 PM 12/15 | 4.21 | 0.846 |
| 8:45 PM 12/15 | 4.22 | 0.855 |
| 8:30 PM 12/15 | 4.21 | 0.846 |
| 8:15 PM 12/15 | 4.22 | 0.855 |
| 8:00 PM 12/15 | 4.22 | 0.855 |
| 7:45 PM 12/15 | 4.22 | 0.855 |
| 7:30 PM 12/15 | 4.22 | 0.855 |
| 7:15 PM 12/15 | 4.23 | 0.863 |
| 7:00 PM 12/15 | 4.23 | 0.863 |
| 6:45 PM 12/15 | 4.23 | 0.863 |
| 6:30 PM 12/15 | 4.22 | 0.855 |
| 6:15 PM 12/15 | 4.22 | 0.855 |
| 6:00 PM 12/15 | 4.22 | 0.855 |
25' -
Water reaches the bottom of the gagehouse.
21' -
Though very unlikely to occur, at this level water approaches the bottom of the Highway 32 bridge.
17' -
The federal levee is threatened with overtopping which would cause widespread flooding in West Point.
16' -
The west approach to State Highway 32 just west of the gage floods.
12' -
Significant lowland flooding of agricultural areas is well underway.
| Date | Stage (ft) |
|---|---|
| Mar 9, 1993 | 18.6 |
| Mar 13, 2019 | 17.66 |
| Mar 12, 2010 | 17.48 |
| Mar 16, 2001 | 17.23 |
| Mar 5, 1994 | 16.97 |
| Feb 24, 1997 | 16.5 |
| Feb 12, 2009 | 16.43 |
| Feb 22, 1982 | 16.37 |
| Mar 18, 1978 | 16.09 |
| Jun 21, 1960 | 16.09 |
| Mar 25, 1962 | 15.9 |
| Jun 6, 1940 | 15.46 |
| Jun 17, 2010 | 15.21 |
| Feb 19, 1971 | 15.05 |
| Feb 20, 1997 | 14.96 |
| Jun 17, 1990 | 14.71 |
| Feb 22, 2011 | 14.68 |
| Jun 12, 1944 | 14.3 |
| Mar 25, 1951 | 14.2 |
| Jul 9, 1993 | 14.02 |
Data provided by the National Weather Service.