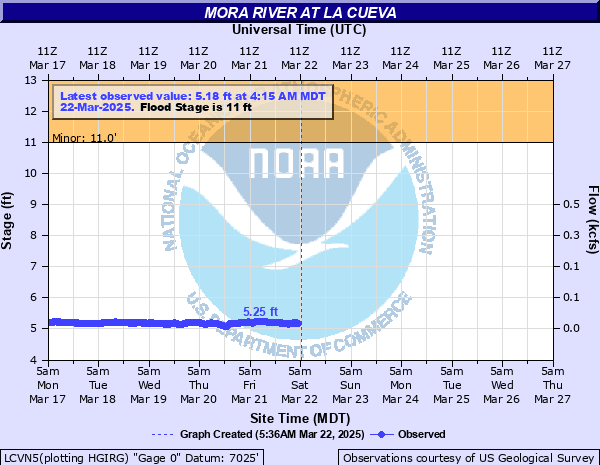
Mora River at La Cueva
Critical Stages
11' - Action
11' - Flood
13' - Moderate
14' - Major
Latest Observation
Updated: 2:15 AM MST 12/16/25
Status: No Flooding
Stage: 5.25 ft
Flow: 0.0302 kcfs
Forecast
Forecast not available for this location.
| Time | Stage (ft) | Flow (kcfs) |
|---|---|---|
| 2:15 AM 12/16 | 5.25 | 0.0302 |
| 2:00 AM 12/16 | 5.25 | 0.0302 |
| 1:45 AM 12/16 | 5.24 | 0.0294 |
| 1:30 AM 12/16 | 5.24 | 0.0294 |
| 1:15 AM 12/16 | 5.25 | 0.0302 |
| 1:00 AM 12/16 | 5.25 | 0.0302 |
| 12:45 AM 12/16 | 5.25 | 0.0302 |
| 12:30 AM 12/16 | 5.25 | 0.0302 |
| 12:15 AM 12/16 | 5.24 | 0.0294 |
| 12:00 AM 12/16 | 5.24 | 0.0294 |
| 11:45 PM 12/15 | 5.23 | 0.0287 |
| 11:30 PM 12/15 | 5.24 | 0.0294 |
| 11:15 PM 12/15 | 5.24 | 0.0294 |
| 11:00 PM 12/15 | 5.23 | 0.0287 |
| 10:45 PM 12/15 | 5.25 | 0.0302 |
| 10:30 PM 12/15 | 5.24 | 0.0294 |
| 10:15 PM 12/15 | 5.24 | 0.0294 |
| 10:00 PM 12/15 | 5.25 | 0.0302 |
| 9:45 PM 12/15 | 5.25 | 0.0302 |
| 9:30 PM 12/15 | 5.25 | 0.0302 |
| 9:15 PM 12/15 | 5.25 | 0.0302 |
| 9:00 PM 12/15 | 5.26 | 0.0309 |
| 8:45 PM 12/15 | 5.25 | 0.0302 |
| 8:30 PM 12/15 | 5.26 | 0.0309 |
| 8:15 PM 12/15 | 5.26 | 0.0309 |
| 8:00 PM 12/15 | 5.25 | 0.0302 |
| 7:45 PM 12/15 | 5.26 | 0.0309 |
| 7:30 PM 12/15 | 5.26 | 0.0309 |
| 7:15 PM 12/15 | 5.26 | 0.0309 |
| 7:00 PM 12/15 | 5.26 | 0.0309 |
14' -
The greatest flood since at least 1913 is in progress near and downstream from La Cueva. Backwater flooding may result in water flowing onto state road 442 near its intersection with highway 518 at La Cueva, halting traffic. Nearby and downstream private river crossings may become unsafe or impassable due to high water although public bridges may remain passable. Significant inundation of pasture and range land persists.
11' -
Pasture and range land both upstream and downstream from the La Cueva river gaging site is becoming further inundated as the river has overtopped its natural banks. Water is still passing under the state highway 518 bridge at La Cueva but smaller private bridge crossings downstream may be overtopped by high water. Irrigation systems may also be damaged.
| Date | Stage (ft) |
|---|---|
| Sep 29, 1904 | 16 |
| Jun 16, 1963 | 8.33 |
| Jun 17, 1965 | 8.22 |
| Sep 13, 2013 | 8.08 |
| Aug 1, 2010 | 7.92 |
| Jun 17, 2015 | 7.63 |
| Aug 1, 1951 | 7.18 |
| Jul 11, 1955 | 7.07 |
| Jun 7, 2014 | 6.61 |
| Jul 23, 1978 | 6.58 |
| Jun 24, 1979 | 6.56 |
| May 19, 1994 | 5.89 |
| Jun 19, 1995 | 5.83 |
| Apr 30, 1999 | 5.56 |
| May 22, 1991 | 5.4 |
| Jul 15, 2008 | 4.65 |
| Aug 5, 2004 | 4.4 |
Data provided by the National Weather Service.