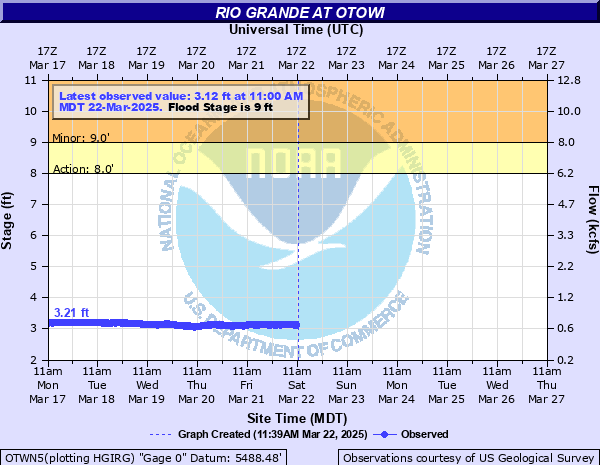
Rio Grande at Otowi
Critical Stages
8' - Action
9' - Flood
13' - Moderate
17' - Major
Latest Observation
Updated: 1:56 AM MST 12/16/25
Status: No Flooding
Stage: 4.1 ft
Flow: 1.21 kcfs
Forecast
Forecast not available for this location.
| Time | Stage (ft) | Flow (kcfs) |
|---|---|---|
| 2:56 AM 12/16 | 4.07 | 1.19 |
| 2:41 AM 12/16 | 4.07 | 1.19 |
| 2:26 AM 12/16 | 4.09 | 1.2 |
| 2:11 AM 12/16 | 4.1 | 1.21 |
| 1:56 AM 12/16 | 4.1 | 1.21 |
| 1:41 AM 12/16 | 4.1 | 1.21 |
| 1:26 AM 12/16 | 4.12 | 1.23 |
| 1:11 AM 12/16 | 4.11 | 1.22 |
| 12:56 AM 12/16 | 4.12 | 1.23 |
| 12:41 AM 12/16 | 4.15 | 1.25 |
| 12:26 AM 12/16 | 4.15 | 1.25 |
| 12:11 AM 12/16 | 4.17 | 1.27 |
| 11:56 PM 12/15 | 4.19 | 1.28 |
| 11:41 PM 12/15 | 4.19 | 1.28 |
| 11:26 PM 12/15 | 4.2 | 1.29 |
| 11:11 PM 12/15 | 4.22 | 1.31 |
| 10:56 PM 12/15 | 4.26 | 1.34 |
| 10:41 PM 12/15 | 4.28 | 1.36 |
| 10:26 PM 12/15 | 4.3 | 1.38 |
| 10:11 PM 12/15 | 4.33 | 1.41 |
| 9:56 PM 12/15 | 4.34 | 1.41 |
| 9:41 PM 12/15 | 4.35 | 1.42 |
| 9:26 PM 12/15 | 4.35 | 1.42 |
| 9:11 PM 12/15 | 4.36 | 1.43 |
| 8:56 PM 12/15 | 4.38 | 1.45 |
| 8:41 PM 12/15 | 4.4 | 1.47 |
| 8:26 PM 12/15 | 4.36 | 1.43 |
| 8:11 PM 12/15 | 4.38 | 1.45 |
| 7:56 PM 12/15 | 4.38 | 1.45 |
| 7:41 PM 12/15 | 4.37 | 1.44 |
17' -
Flooding along the Rio Grande from above Cochiti Lake to Espanola exceeds the flood of 1920 and may exceed any flood level since 1740. Portions of San Ildefonso and Santa Clara Pueblos are inundated as are parts of Espanola.
13' -
Cultivated lands upriver through San Ildefonso and Santa Clara Pueblos are being inundated. Backwater flooding is occurring where creeks and arroyos join the Rio Grande. Debris in the fast flowing water could result in debris damming at nearby bridges causing local overflows. The flow in the river is approaching the flood flow of 1941 which was estimated at 22,500 cubic feet per second.
9' -
Flooding of cultivated lands upstream of the Otowi gage will increase if water levels rise further. Fast flowing water could undermine the river banks.
| Date | Stage (ft) |
|---|---|
| Sep 29, 1904 | 14.5 |
| May 23, 1920 | 14.1 |
| May 16, 1941 | 13.54 |
| Oct 7, 1911 | 13.1 |
| May 25, 1905 | 12.05 |
| May 11, 1916 | 10.93 |
| Apr 23, 1942 | 10.22 |
| May 24, 1919 | 10.1 |
| May 14, 1924 | 10.06 |
| May 10, 1985 | 9.96 |
| Jun 9, 1979 | 9.93 |
| May 20, 1932 | 9.84 |
| May 19, 1994 | 9.03 |
| May 27, 2005 | 8.61 |
| Jul 6, 1995 | 8.44 |
| Jun 8, 1997 | 7.76 |
| May 11, 2009 | 7.22 |
| May 24, 2008 | 7.21 |
Data provided by the National Weather Service.