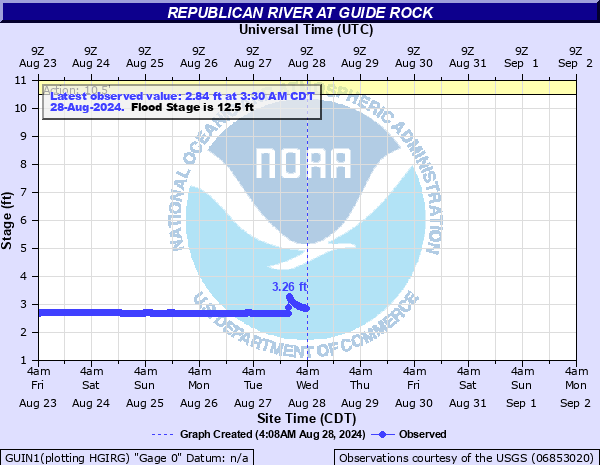
Republican River at Guide Rock
Critical Stages
10.5' - Action
12.5' - Flood
15' - Moderate
17' - Major
Latest Observation
Updated: 2:30 AM CST 12/16/25
Status: No Flooding
Stage: 3.93 ft
Flow: 0.063 kcfs
Forecast
Forecast not available for this location.
| Time | Stage (ft) | Flow (kcfs) |
|---|---|---|
| 2:30 AM 12/16 | 3.93 | 0.063 |
| 2:15 AM 12/16 | 3.93 | 0.063 |
| 2:00 AM 12/16 | 3.93 | 0.063 |
| 1:45 AM 12/16 | 3.93 | 0.063 |
| 1:30 AM 12/16 | 3.93 | 0.063 |
| 1:15 AM 12/16 | 3.93 | 0.063 |
| 1:00 AM 12/16 | 3.93 | 0.063 |
| 12:45 AM 12/16 | 3.94 | 0.0637 |
| 12:30 AM 12/16 | 3.94 | 0.0637 |
| 12:15 AM 12/16 | 3.95 | 0.0644 |
| 12:00 AM 12/16 | 3.95 | 0.0644 |
| 11:45 PM 12/15 | 3.96 | 0.0651 |
| 11:30 PM 12/15 | 3.97 | 0.0658 |
| 11:15 PM 12/15 | 3.97 | 0.0658 |
| 11:00 PM 12/15 | 3.97 | 0.0658 |
| 10:45 PM 12/15 | 3.97 | 0.0658 |
| 10:30 PM 12/15 | 3.96 | 0.0651 |
| 10:15 PM 12/15 | 3.95 | 0.0644 |
| 10:00 PM 12/15 | 3.95 | 0.0644 |
| 9:45 PM 12/15 | 3.94 | 0.0637 |
| 9:30 PM 12/15 | 3.94 | 0.0637 |
| 9:15 PM 12/15 | 3.94 | 0.0637 |
| 9:00 PM 12/15 | 3.93 | 0.063 |
| 8:45 PM 12/15 | 3.93 | 0.063 |
| 8:30 PM 12/15 | 3.93 | 0.063 |
| 8:15 PM 12/15 | 3.93 | 0.063 |
| 8:00 PM 12/15 | 3.93 | 0.063 |
| 7:45 PM 12/15 | 3.93 | 0.063 |
| 7:30 PM 12/15 | 3.94 | 0.0637 |
| 7:15 PM 12/15 | 3.94 | 0.0637 |
21.5' -
Floodwaters reach the bottom of the bridge at the gage site.
15' -
Highway 78 south of the bridge will be impacted along with numerous county roads including River Road as well as Road B and E. In addition, a home will be threatened downstream on the south side of the river off of Road 3600 south of Superior. This home required sandbagging during the July flooding of 2019 when the river crest at Guide Rock reached 15.1 feet.
12.5' -
Minor agricultural lowland flooding occurs and roads B and E will begin to be impacted.
10.5' -
Water begins spilling out of the river banks.
| Date | Stage (ft) |
|---|---|
| Jul 19, 1993 | 15.47 |
| Jul 11, 2019 | 15.08 |
| May 28, 2019 | 14.85 |
| Aug 25, 2019 | 14.31 |
| May 25, 2008 | 14.06 |
| May 15, 1985 | 13.63 |
| Jul 13, 1992 | 13.38 |
| Jul 19, 2017 | 13.31 |
| May 25, 2011 | 12.95 |
| May 23, 2020 | 12.82 |
| Jun 13, 2010 | 12.51 |
| May 6, 2007 | 12.44 |
| Jul 5, 2000 | 12.4 |
| Jul 1, 1989 | 12.25 |
| Jul 23, 1996 | 11.64 |
| Mar 15, 2021 | 11.64 |
| May 21, 1999 | 11.22 |
| Jul 19, 1988 | 10.9 |
| Aug 3, 1990 | 10.83 |
| Mar 23, 1987 | 10.77 |
Data provided by the National Weather Service.