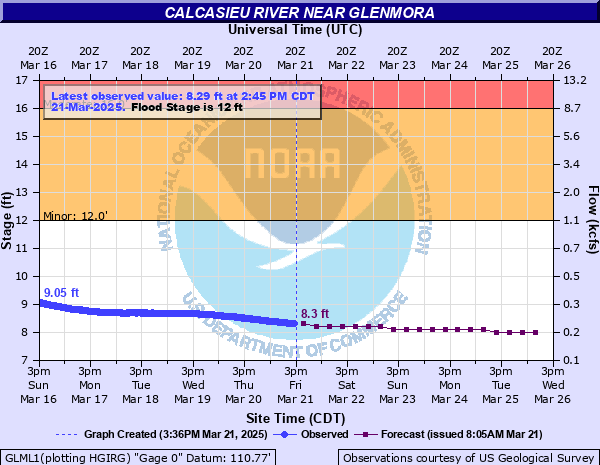
Calcasieu River near Glenmora
Critical Stages
12' - Action
12' - Flood
16' - Moderate
18' - Major
Latest Observation
Updated: 1:45 PM CST 12/15/25
Status: No Flooding
Stage: 5.98 ft
Flow: 0.0694 kcfs
Forecast
| Time | Stage (ft) | Flow (kcfs) |
|---|---|---|
| 6 PM 12/15 | 6 | 0.0704 |
| 12 AM 12/16 | 6 | 0.0704 |
| 6 AM 12/16 | 6 | 0.0704 |
| 12 PM 12/16 | 5.9 | 0.0657 |
| 6 PM 12/16 | 5.9 | 0.0657 |
| 12 AM 12/17 | 5.9 | 0.0657 |
| 6 AM 12/17 | 5.9 | 0.0657 |
| 12 PM 12/17 | 5.9 | 0.0657 |
| 6 PM 12/17 | 5.8 | 0.0612 |
| 12 AM 12/18 | 5.8 | 0.0612 |
| 6 AM 12/18 | 5.8 | 0.0612 |
| 12 PM 12/18 | 5.8 | 0.0612 |
| 6 PM 12/18 | 5.8 | 0.0612 |
| 12 AM 12/19 | 5.8 | 0.0612 |
| 6 AM 12/19 | 5.8 | 0.0612 |
| 12 PM 12/19 | 5.8 | 0.0612 |
| 6 PM 12/19 | 5.8 | 0.0612 |
| 12 AM 12/20 | 5.7 | 0.057 |
| 6 AM 12/20 | 5.7 | 0.057 |
| Time | Stage (ft) | Flow (kcfs) |
|---|---|---|
| 1:45 PM 12/15 | 5.98 | 0.0694 |
| 1:30 PM 12/15 | 5.99 | 0.0699 |
| 1:15 PM 12/15 | 5.99 | 0.0699 |
| 1:00 PM 12/15 | 5.99 | 0.0699 |
| 12:45 PM 12/15 | 5.99 | 0.0699 |
| 12:30 PM 12/15 | 5.99 | 0.0699 |
| 12:15 PM 12/15 | 6 | 0.0704 |
| 12:00 PM 12/15 | 6 | 0.0704 |
| 11:45 AM 12/15 | 6 | 0.0704 |
| 11:30 AM 12/15 | 6 | 0.0704 |
| 11:15 AM 12/15 | 6 | 0.0704 |
| 11:00 AM 12/15 | 6 | 0.0704 |
| 10:45 AM 12/15 | 6 | 0.0704 |
| 10:30 AM 12/15 | 6 | 0.0704 |
| 10:15 AM 12/15 | 6.01 | 0.0709 |
| 10:00 AM 12/15 | 6.01 | 0.0709 |
| 9:45 AM 12/15 | 6.01 | 0.0709 |
| 9:30 AM 12/15 | 6.01 | 0.0709 |
| 9:15 AM 12/15 | 6.01 | 0.0709 |
| 9:00 AM 12/15 | 6.01 | 0.0709 |
| 8:45 AM 12/15 | 6.02 | 0.0713 |
| 8:30 AM 12/15 | 6.02 | 0.0713 |
| 8:15 AM 12/15 | 6.02 | 0.0713 |
| 8:00 AM 12/15 | 6.02 | 0.0713 |
| 7:45 AM 12/15 | 6.03 | 0.0718 |
| 7:30 AM 12/15 | 6.03 | 0.0718 |
| 7:15 AM 12/15 | 6.03 | 0.0718 |
| 7:00 AM 12/15 | 6.03 | 0.0718 |
| 6:45 AM 12/15 | 6.03 | 0.0718 |
| 6:30 AM 12/15 | 6.03 | 0.0718 |
22' -
Flood waters reach the main beam underclearance of the bridge on Hwy 113. Water may also flow over Hwy 113 between the bridge and West River Road. When the river is rising and forecast to reach 22 feet, portions of Highway 121 near Hineston are subject to flooding.
21.55' -
The river is at its flood of record. Widespread major flooding will occur. West River Road between Highway 112 and Highway 113 will have water over it in a couple of locations.
20' -
When the river is rising and forecast to reach 20 feet, Highway 112 begins to flood between Strothers Crossing and West River Road.
19' -
When the river is rising and forecast to reach 19 feet at Glenmora, flooding of several structures near Beechwood Church is possible.
18' -
Numerous roads near the river are closed, including Highway 112 which is flooded for about 1.5 miles between Highway 121 and Beechwood Church. Major flood damage downstream will occur downstream of the gauge.
16' -
When the river is rising and forecast to reach 16 feet, portions of Highway 112 between Highway 121 and Beechwood Church is subject to flooding.
15' -
Flooding of secondary roads near the river and its tributaries begins, including Ashmore Road. Strothers Crossing Road near Calcasieu and Price Crossing Road near Hineston have several feet of water over them and subject to washouts.
14' -
Some roads upstream from Glenmora, including Strothers Crossing Road near the community of Calcasieu and Price Crossing Road near Hineston have two to three feet of water over the road and are subject to being closed. Flooding of forested areas near the river will also occur.
12' -
When the river is falling and the gauge reading is forecast to be near 12 feet, flooding of forested areas near the river will occur.
12' -
When the river is rising and the gauge reading is forecast to reach 12 feet or higher. Roads upstream from Glenmora, including Strothers Crossing Road near the community of Calcasieu and Price Crossing Road near Hineston have water on them and are subject to being closed. Also, flooding of forested areas near the river will occur.
| Date | Stage (ft) |
|---|---|
| May 19, 1953 | 21.55 |
| May 12, 2016 | 20.46 |
| Jun 29, 1989 | 20.46 |
| Dec 28, 1982 | 20.4 |
| Feb 12, 1966 | 20.29 |
| Apr 4, 2017 | 20.22 |
| Mar 23, 2012 | 19.09 |
| Apr 25, 1952 | 19.02 |
| Feb 14, 1950 | 18.82 |
| Mar 31, 2018 | 18.77 |
| May 15, 2004 | 18.7 |
| Jan 29, 1994 | 18.48 |
| Nov 7, 2002 | 18.44 |
| Nov 3, 2015 | 18.26 |
| Mar 8, 1995 | 18.19 |
| Oct 13, 2020 | 18.13 |
| Apr 4, 1945 | 18 |
| Nov 26, 2004 | 17.88 |
| Oct 31, 1985 | 17.81 |
| Nov 30, 2001 | 17.77 |
Data provided by the National Weather Service.