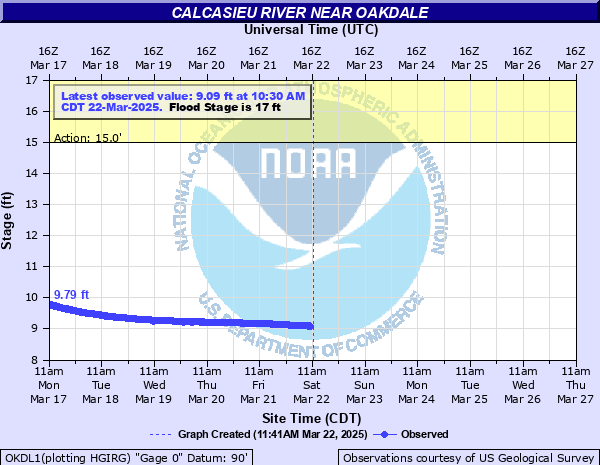
Calcasieu River near Oakdale
Critical Stages
15' - Action
17' - Flood
21' - Moderate
27' - Major
Latest Observation
Updated: 1:30 PM CST 12/15/25
Status: No Flooding
Stage: 8.37 ft
Flow: 0.0943 kcfs
Forecast
Forecast not available for this location.
| Time | Stage (ft) | Flow (kcfs) |
|---|---|---|
| 1:30 PM 12/15 | 8.37 | 0.0943 |
| 1:15 PM 12/15 | 8.38 | 0.0964 |
| 1:00 PM 12/15 | 8.38 | 0.0964 |
| 12:45 PM 12/15 | 8.38 | 0.0964 |
| 12:30 PM 12/15 | 8.38 | 0.0964 |
| 12:15 PM 12/15 | 8.38 | 0.0964 |
| 12:00 PM 12/15 | 8.38 | 0.0964 |
| 11:45 AM 12/15 | 8.38 | 0.0964 |
| 11:30 AM 12/15 | 8.38 | 0.0964 |
| 11:15 AM 12/15 | 8.38 | 0.0964 |
| 11:00 AM 12/15 | 8.38 | 0.0964 |
| 10:45 AM 12/15 | 8.38 | 0.0964 |
| 10:30 AM 12/15 | 8.38 | 0.0964 |
| 10:15 AM 12/15 | 8.38 | 0.0964 |
| 10:00 AM 12/15 | 8.38 | 0.0964 |
| 9:45 AM 12/15 | 8.38 | 0.0964 |
| 9:30 AM 12/15 | 8.38 | 0.0964 |
| 9:15 AM 12/15 | 8.38 | 0.0964 |
| 9:00 AM 12/15 | 8.38 | 0.0964 |
| 8:45 AM 12/15 | 8.38 | 0.0964 |
| 8:30 AM 12/15 | 8.38 | 0.0964 |
| 8:15 AM 12/15 | 8.38 | 0.0964 |
| 8:00 AM 12/15 | 8.39 | 0.0986 |
| 7:45 AM 12/15 | 8.39 | 0.0986 |
| 7:30 AM 12/15 | 8.39 | 0.0986 |
| 7:15 AM 12/15 | 8.39 | 0.0986 |
| 7:00 AM 12/15 | 8.39 | 0.0986 |
| 6:45 AM 12/15 | 8.39 | 0.0986 |
| 6:30 AM 12/15 | 8.39 | 0.0986 |
| 6:15 AM 12/15 | 8.39 | 0.0986 |
29' -
Catastrophic flooding with upper level of sewage plant beginning to flood.
27.65' -
River is at its flood of record. Flood waters reach the top of the rail on the railroad bridge. Considerable residential flooding will occur.
27' -
Major flooding occurs with the river at the floor of the railroad bridge.
25.7' -
Flood waters reach the underclearance of the railroad bridge.
24' -
Approximately 60 homes are flooded.
22' -
Approximately 50 homes are flooded.
21' -
Lowland areas near lower level of sewage plant and approximately 30 homes begin to flood.
19' -
Low secondary roads near the river begin to flood. Several houses in close proximity to the river are subject to flooding.
17' -
Minor lowland flooding, mainly forested areas along the river will occur. Park and picnic ground off of Highway 10 begins to flood.
| Date | Stage (ft) |
|---|---|
| May 19, 1953 | 27.62 |
| May 2, 1953 | 26.36 |
| Jun 30, 1989 | 26 |
| Mar 13, 2016 | 24.7 |
| Feb 13, 1966 | 24.53 |
| Apr 5, 2017 | 24.1 |
| May 16, 2004 | 23 |
| Sep 2, 2017 | 21.8 |
| Mar 24, 2012 | 21.8 |
| Nov 6, 2002 | 21 |
| Nov 4, 2015 | 21 |
| Feb 25, 2003 | 20.6 |
| Oct 30, 2002 | 20.3 |
| Aug 7, 1955 | 20.1 |
| May 7, 1975 | 20.09 |
| Feb 16, 2004 | 20 |
| Dec 1, 2001 | 19.74 |
| Jan 11, 1961 | 19.71 |
| Apr 19, 1973 | 19.7 |
| Dec 9, 2002 | 19.5 |
Data provided by the National Weather Service.