Goose Creek (ID) near Oakley
Critical Stages
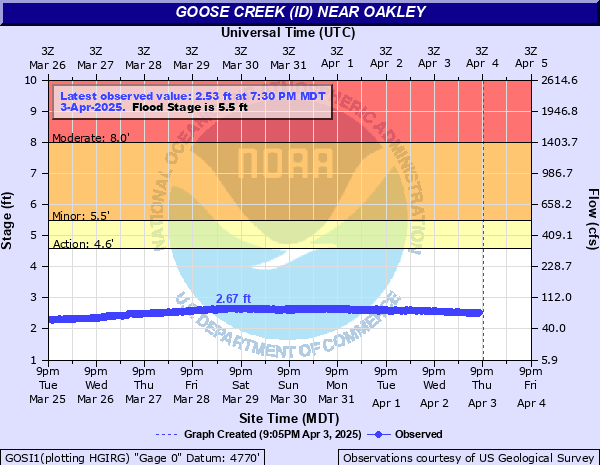
4.6' - Action
5.5' - Flood
8' - Moderate
Major
Latest Observation
Updated: 8:30 AM MST 12/16/25
Status: No Flooding
Stage: 1.98 ft
Flow: 0.03 kcfs
Forecast
Forecast not available for this location.
| Time | Stage (ft) | Flow (kcfs) |
|---|---|---|
| 8:30 AM 12/16 | 1.98 | 0.03 |
| 8:15 AM 12/16 | 1.97 | 0.03 |
| 8:00 AM 12/16 | 1.98 | 0.03 |
| 7:45 AM 12/16 | 1.97 | 0.03 |
| 7:30 AM 12/16 | 1.97 | 0.03 |
| 7:15 AM 12/16 | 1.97 | 0.03 |
| 7:00 AM 12/16 | 1.97 | 0.03 |
| 6:45 AM 12/16 | 1.97 | 0.03 |
| 6:30 AM 12/16 | 1.96 | 0.029 |
| 6:15 AM 12/16 | 1.97 | 0.03 |
| 6:00 AM 12/16 | 1.96 | 0.029 |
| 5:45 AM 12/16 | 1.97 | 0.03 |
| 5:30 AM 12/16 | 1.96 | 0.029 |
| 5:15 AM 12/16 | 1.97 | 0.03 |
| 5:00 AM 12/16 | 1.96 | 0.029 |
| 4:45 AM 12/16 | 1.96 | 0.029 |
| 4:30 AM 12/16 | 1.96 | 0.029 |
| 4:15 AM 12/16 | 1.96 | 0.029 |
| 4:00 AM 12/16 | 1.96 | 0.029 |
| 3:45 AM 12/16 | 1.96 | 0.029 |
| 3:30 AM 12/16 | 1.97 | 0.03 |
| 3:15 AM 12/16 | 1.97 | 0.03 |
| 3:00 AM 12/16 | 1.98 | 0.03 |
| 2:45 AM 12/16 | 1.97 | 0.03 |
| 2:30 AM 12/16 | 1.98 | 0.03 |
| 2:15 AM 12/16 | 1.98 | 0.03 |
| 2:00 AM 12/16 | 1.97 | 0.03 |
| 1:45 AM 12/16 | 1.98 | 0.03 |
| 1:30 AM 12/16 | 1.99 | 0.031 |
| 1:15 AM 12/16 | 1.98 | 0.03 |
8' -
Goose Creek Road south of Double Diamond Ranch to Spring Creek will have water inundation problems and with additional extensive flooding in ranch and cropland southward to the Utah border. Flooding like February 2017 can be expected.
5.5' -
Ranch and lowland crop flooding upriver from Oakley Reservoir southward to the Utah border. Side roads across the creek impacted. Cropland near Double Diamond Ranch starts to have water problems.
4.6' -
Isolated ranch and lowland crop flooding upriver from Oakley Reservoir southward to the Utah border.
| Date | Stage (ft) |
|---|---|
| Feb 10, 2017 | 11.28 |
| Jan 18, 1971 | 9.3 |
| Feb 11, 1962 | 9.3 |
| Jan 23, 1943 | 7.6 |
| May 15, 1984 | 7.29 |
| Jan 14, 1980 | 6.62 |
| Mar 7, 1979 | 6.56 |
| Feb 1, 1995 | 6.37 |
| Feb 17, 2016 | 5.86 |
| Mar 1, 2006 | 5.85 |
| May 19, 2011 | 5.82 |
| Jun 2, 2019 | 5.23 |
| Feb 14, 2014 | 4.98 |
| Jun 24, 2009 | 4.38 |
| May 27, 2015 | 4.19 |
| May 23, 2008 | 4.19 |
| Sep 15, 2013 | 4.12 |
| May 4, 2020 | 3.81 |
| Apr 24, 2010 | 3.73 |
| Mar 28, 2012 | 3.62 |
Data provided by the National Weather Service.