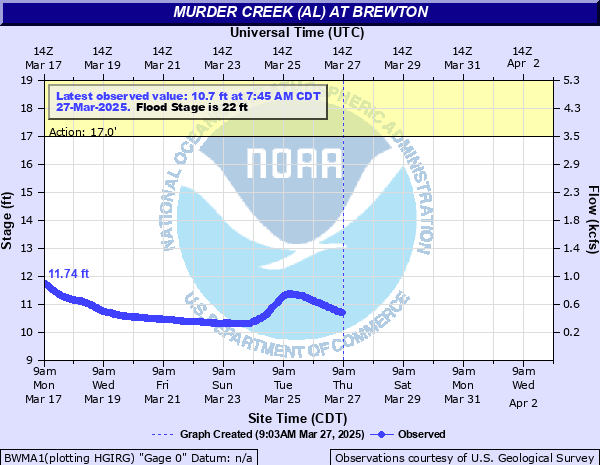
Murder Creek (AL) at Brewton
Critical Stages
17' - Action
22' - Flood
25' - Moderate
29' - Major
Latest Observation
Updated: 4:45 PM CST 12/15/25
Status: No Flooding
Stage: 9.96 ft
Flow: 0.206 kcfs
Forecast
Forecast not available for this location.
| Time | Stage (ft) | Flow (kcfs) |
|---|---|---|
| 4:45 PM 12/15 | 9.96 | 0.206 |
| 4:30 PM 12/15 | 9.95 | 0.204 |
| 4:15 PM 12/15 | 9.95 | 0.204 |
| 4:00 PM 12/15 | 9.96 | 0.206 |
| 3:45 PM 12/15 | 9.96 | 0.206 |
| 3:30 PM 12/15 | 9.96 | 0.206 |
| 3:15 PM 12/15 | 9.96 | 0.206 |
| 3:00 PM 12/15 | 9.95 | 0.204 |
| 2:45 PM 12/15 | 9.95 | 0.204 |
| 2:30 PM 12/15 | 9.95 | 0.204 |
| 2:15 PM 12/15 | 9.96 | 0.206 |
| 2:00 PM 12/15 | 9.96 | 0.206 |
| 1:45 PM 12/15 | 9.96 | 0.206 |
| 1:30 PM 12/15 | 9.97 | 0.209 |
| 1:15 PM 12/15 | 9.96 | 0.206 |
| 1:00 PM 12/15 | 9.96 | 0.206 |
| 12:45 PM 12/15 | 9.95 | 0.204 |
| 12:30 PM 12/15 | 9.96 | 0.206 |
| 12:15 PM 12/15 | 9.96 | 0.206 |
| 12:00 PM 12/15 | 9.96 | 0.206 |
| 11:45 AM 12/15 | 9.97 | 0.209 |
| 11:30 AM 12/15 | 9.95 | 0.204 |
| 11:15 AM 12/15 | 9.97 | 0.209 |
| 11:00 AM 12/15 | 9.96 | 0.206 |
| 10:45 AM 12/15 | 9.97 | 0.209 |
| 10:30 AM 12/15 | 9.97 | 0.209 |
| 10:15 AM 12/15 | 9.96 | 0.206 |
| 10:00 AM 12/15 | 9.97 | 0.209 |
| 9:45 AM 12/15 | 9.96 | 0.206 |
| 9:30 AM 12/15 | 9.96 | 0.206 |
37' -
Severe flooding in Brewton and East Brewton.
33' -
The Highway 29 Bridge across Murder Creek and Highway 31 Bridge across Burnt Corn Creek will be flooded.
30' -
Severe flooding will occur in Brewton south of Court and East Streets.
27' -
Highway 31 begins to flood.
25' -
Water will reach to Downing Street in Brewton. Portions of Snowden Street in East Brewton will become flooded. Flooding of Highway 29 will worsen and become impassable. St. Nicholas street begins to flood.
24' -
Flooding of Highway 29/Mildred Street begins.
22' -
Flooding of Persimmon and Ann Streets will begin.
| Date | Stage (ft) |
|---|---|
| Mar 15, 1929 | 37 |
| Mar 17, 1990 | 32.61 |
| Mar 13, 1990 | 30.93 |
| Jul 8, 1916 | 30.2 |
| Apr 11, 1975 | 29.9 |
| Dec 15, 2009 | 28.27 |
| Mar 9, 1998 | 27.9 |
| Sep 17, 2020 | 27.64 |
| Oct 6, 2021 | 26.86 |
| Aug 1, 1975 | 26.7 |
| Sep 30, 1998 | 25.9 |
| Mar 4, 2001 | 24.44 |
| Jan 26, 1978 | 24.4 |
| Oct 6, 1995 | 23.5 |
| Jan 4, 2017 | 23.29 |
| Apr 14, 1980 | 23.12 |
| Dec 26, 2015 | 22.55 |
| Feb 6, 2022 | 22.54 |
| Sep 27, 1939 | 22.5 |
| May 15, 2014 | 22.22 |
Data provided by the National Weather Service.