« Back to Jefferson County Rivers
Black Earth Creek at Black Earth
Critical Stages
5' - Action
5.5' - Flood
7' - Moderate
8' - Major
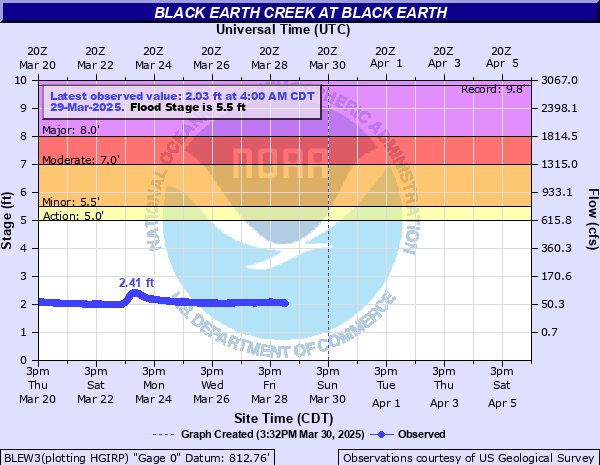
Latest Observation
Updated: 4:00 AM CST 12/8/25
Status: No Flooding
Stage: 2.01 ft
Flow: 0.0216 kcfs
Forecast
Forecast not available for this location.
| Time | Stage (ft) | Flow (kcfs) |
|---|---|---|
| 4:00 AM 12/8 | 2.01 | 0.0216 |
| 3:45 AM 12/8 | 2.01 | 0.0216 |
| 3:30 AM 12/8 | 2.02 | 0.0223 |
| 3:15 AM 12/8 | 2.02 | 0.0223 |
| 3:00 AM 12/8 | 2.02 | 0.0223 |
| 2:45 AM 12/8 | 2.03 | 0.0229 |
| 2:30 AM 12/8 | 2.03 | 0.0229 |
| 2:15 AM 12/8 | 2.04 | 0.0236 |
| 2:00 AM 12/8 | 2.04 | 0.0236 |
| 1:45 AM 12/8 | 2.04 | 0.0236 |
| 1:30 AM 12/8 | 2.04 | 0.0236 |
| 1:15 AM 12/8 | 2.05 | 0.0243 |
| 1:00 AM 12/8 | 2.05 | 0.0243 |
| 12:45 AM 12/8 | 2.06 | 0.025 |
| 12:30 AM 12/8 | 2.06 | 0.025 |
| 12:15 AM 12/8 | 2.06 | 0.025 |
| 12:00 AM 12/8 | 2.06 | 0.025 |
| 11:45 PM 12/7 | 2.06 | 0.025 |
| 11:30 PM 12/7 | 2.07 | 0.0257 |
| 11:15 PM 12/7 | 2.06 | 0.025 |
| 11:00 PM 12/7 | 2.06 | 0.025 |
| 10:45 PM 12/7 | 2.06 | 0.025 |
| 10:30 PM 12/7 | 2.06 | 0.025 |
| 10:15 PM 12/7 | 2.07 | 0.0257 |
| 10:00 PM 12/7 | 2.06 | 0.025 |
| 9:45 PM 12/7 | 2.07 | 0.0257 |
| 9:30 PM 12/7 | 2.06 | 0.025 |
| 9:15 PM 12/7 | 2.07 | 0.0257 |
| 9:00 PM 12/7 | 2.07 | 0.0257 |
| 8:45 PM 12/7 | 2.06 | 0.025 |
9' -
Water over roads and into basements throughout north end of village.
8' -
Water up to base of Olsen Rd bridge, downstream of village. Water up to base of Park St bridge. Community Park is flooded. Park St is flooded near the park.
7' -
Community Park is flooded. Park St near Community Park partially covered by water, water up to base of Railroad bridge east of Community Park. Water 1 foot from base of Park St Brdige. Water over Olsen Rd near Hwy DP, downstream of village. Water about 1 foot below Olsen Rd bridge deck. Water up to base of South Valley Rd bridge, upstream of village.
5.5' -
Flooding effects are confined mainly to lowland and agricultural land.
5' -
There is minor lowland flooding.
4.5' -
There is minor lowland flooding.
| Date | Stage (ft) |
|---|---|
| Aug 21, 2018 | 9.81 |
| Aug 2, 2001 | 7.08 |
| Mar 14, 2019 | 6.75 |
| Jul 3, 1954 | 6.58 |
| Oct 2, 2019 | 6.34 |
| Feb 21, 2018 | 6.21 |
| Jul 6, 1993 | 6.13 |
| Jun 8, 2008 | 6.02 |
| Jul 20, 2017 | 5.97 |
| Jun 11, 1957 | 5.96 |
| Jun 23, 2024 | 5.9 |
| Jun 15, 2016 | 5.86 |
| Apr 1, 1959 | 5.83 |
| Jul 11, 2008 | 5.8 |
| Jul 3, 1960 | 5.8 |
| May 22, 2004 | 5.72 |
| Jul 25, 1985 | 5.65 |
| Oct 2, 2018 | 5.51 |
| Mar 12, 1976 | 5.47 |
| Jun 13, 2008 | 5.4 |
Data provided by the National Weather Service.