« Back to Jefferson County Rivers
Spring Creek at Lodi
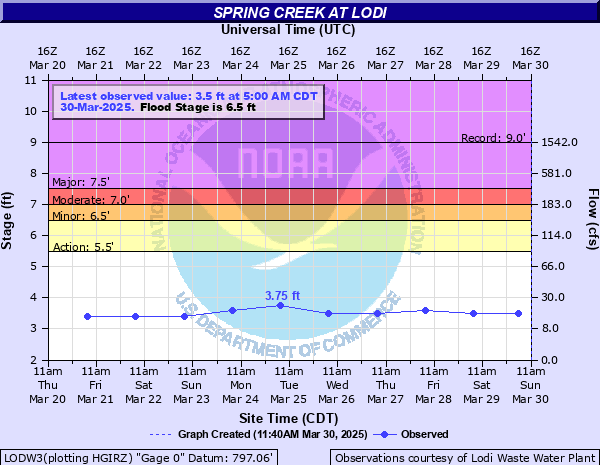
Critical Stages
5.5' - Action
6.5' - Flood
7' - Moderate
7.5' - Major
Latest Observation
Updated: 6:09 PM LMT 12/31/00
Status: Obs Not Current
Stage: -999 ft
Flow: -999 kcfs
Forecast
Forecast not available for this location.
| Time | Stage (ft) | Flow (kcfs) |
|---|---|---|
| 7:00 AM 12/7 | 3.5 | 0.0174 |
| 7:00 AM 12/6 | 3.5 | 0.0174 |
| 7:00 AM 12/5 | 3.5 | 0.0174 |
| 7:00 AM 12/4 | 3.5 | 0.0174 |
| 7:00 AM 12/3 | 3.5 | 0.0174 |
| 7:00 AM 12/2 | 3.5 | 0.0174 |
| 7:00 AM 12/1 | 3.5 | 0.0174 |
| 10:00 AM 11/30 | 3.5 | 0.0174 |
| 7:00 AM 11/29 | 3.5 | 0.0174 |
| 7:00 AM 11/28 | 3.5 | 0.0174 |
| 7:00 AM 11/27 | 3.5 | 0.0174 |
| 7:00 AM 11/26 | 3.5 | 0.0174 |
| 7:00 AM 11/25 | 3.5 | 0.0174 |
| 7:00 AM 11/24 | 3.4 | 0.015 |
| 7:00 AM 11/23 | 3.4 | 0.015 |
| 7:00 AM 11/22 | 3.4 | 0.015 |
| 7:00 AM 11/21 | 3.55 | 0.0186 |
| 7:00 AM 11/20 | 3.3 | 0.0129 |
| 7:00 AM 11/19 | 3.4 | 0.015 |
| 7:00 AM 11/18 | 3.3 | 0.0129 |
| 7:00 AM 11/17 | 3.3 | 0.0129 |
| 7:00 AM 11/16 | 3.5 | 0.0174 |
| 7:00 AM 11/15 | 3.5 | 0.0174 |
| 7:00 AM 11/14 | 3.3 | 0.0129 |
| 7:00 AM 11/13 | 3.3 | 0.0129 |
| 7:00 AM 11/12 | 3.3 | 0.0129 |
| 7:00 AM 11/11 | 3.4 | 0.015 |
| 7:00 AM 11/10 | 3.5 | 0.0174 |
| 5:00 AM 11/9 | 3.65 | 0.0212 |
| 7:00 AM 11/8 | 3.65 | 0.0212 |
8.5' -
Water affects homes and businesses along Water St, S. Main St, and N. Main Street. Basements are affected by water on N Main Street. 4 feet of water into the basements on S Main St.
8' -
There is widespread flooding in Habermann Park, Veterans Park, and Goeres Park, including the baseball diamond.
7.5' -
Floodwaters affect Goeres Park, including the pool and water approaches the Public Works garage and Habermann park including the baseball diamond.
6.5' -
Floodwaters affect Goeres Park.
| Date | Stage (ft) |
|---|---|
| Mar 14, 2019 | 9 |
| Jun 9, 2008 | 8.4 |
| Jun 18, 2014 | 8.4 |
| Mar 11, 2013 | 8 |
| Feb 20, 2018 | 7.9 |
| Aug 19, 2007 | 7.7 |
| Oct 23, 2020 | 7.6 |
| Jun 23, 2024 | 7.5 |
| Oct 2, 2019 | 7.3 |
| Jul 22, 2010 | 7.2 |
| Jul 15, 2010 | 7 |
| Mar 13, 2007 | 7 |
| Jun 23, 2013 | 7 |
| Sep 7, 2016 | 7 |
| Jul 11, 2008 | 7 |
| Mar 6, 2022 | 6.9 |
| May 23, 2004 | 6.88 |
| Jun 27, 2013 | 6.7 |
| Apr 9, 2015 | 6.5 |
| Jun 23, 2010 | 6.4 |
Data provided by the National Weather Service.