« Back to Jefferson County Rivers
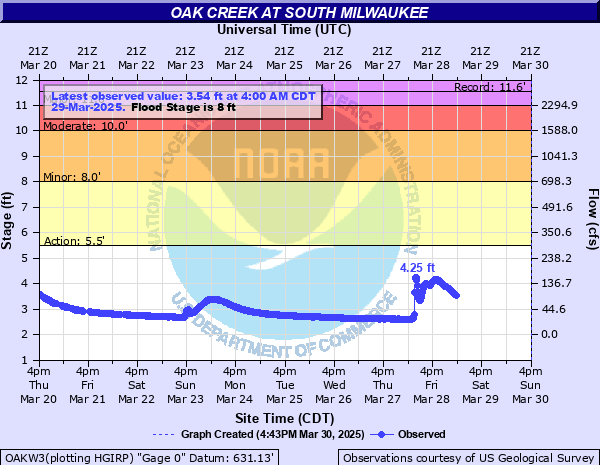
Oak Creek at South Milwaukee
Critical Stages
5.5' - Action
8' - Flood
10' - Moderate
11' - Major
Latest Observation
Updated: 4:00 AM CST 12/8/25
Status: No Flooding
Stage: 2.27 ft
Flow: 0.0022 kcfs
Forecast
Forecast not available for this location.
| Time | Stage (ft) | Flow (kcfs) |
|---|---|---|
| 4:00 AM 12/8 | 2.27 | 0.0022 |
| 3:45 AM 12/8 | 2.27 | 0.0022 |
| 3:30 AM 12/8 | 2.27 | 0.0022 |
| 3:15 AM 12/8 | 2.27 | 0.0022 |
| 3:00 AM 12/8 | 2.27 | 0.0022 |
| 2:45 AM 12/8 | 2.27 | 0.0022 |
| 2:30 AM 12/8 | 2.27 | 0.0022 |
| 2:15 AM 12/8 | 2.27 | 0.0022 |
| 2:00 AM 12/8 | 2.27 | 0.0022 |
| 1:45 AM 12/8 | 2.27 | 0.0022 |
| 1:30 AM 12/8 | 2.27 | 0.0022 |
| 1:15 AM 12/8 | 2.27 | 0.0022 |
| 1:00 AM 12/8 | 2.26 | 0.0019 |
| 12:45 AM 12/8 | 2.27 | 0.0022 |
| 12:30 AM 12/8 | 2.27 | 0.0022 |
| 12:15 AM 12/8 | 2.27 | 0.0022 |
| 12:00 AM 12/8 | 2.27 | 0.0022 |
| 11:45 PM 12/7 | 2.27 | 0.0022 |
| 11:30 PM 12/7 | 2.27 | 0.0022 |
| 11:15 PM 12/7 | 2.27 | 0.0022 |
| 11:00 PM 12/7 | 2.27 | 0.0022 |
| 10:45 PM 12/7 | 2.27 | 0.0022 |
| 10:30 PM 12/7 | 2.27 | 0.0022 |
| 10:15 PM 12/7 | 2.27 | 0.0022 |
| 10:00 PM 12/7 | 2.27 | 0.0022 |
| 9:45 PM 12/7 | 2.27 | 0.0022 |
| 9:30 PM 12/7 | 2.27 | 0.0022 |
| 9:15 PM 12/7 | 2.27 | 0.0022 |
| 9:00 PM 12/7 | 2.27 | 0.0022 |
| 8:45 PM 12/7 | 2.27 | 0.0022 |
10' -
Water impacts the yards of homes along the creek.
9' -
Yards along the creek are flooded. This level is the 1 percent chance flood meaning that there is a 1 percent chance of the river reaching this level in any given year.
8' -
The main effects of flooding at this level are to lowland and wooded land.
7' -
There is flooding to lowland and wooded land in the South Milwaukee area.
6' -
There is minor flooding to lowland and wooded land in the South Milwaukee area.
5.5' -
There is minor flooding to lowland and wooded land in the South Milwaukee area.
| Date | Stage (ft) |
|---|---|
| Jun 7, 2008 | 11.56 |
| Jul 22, 2010 | 11.25 |
| Aug 10, 2025 | 10.52 |
| Sep 12, 2022 | 9.97 |
| Aug 6, 1986 | 9.88 |
| Jun 21, 1997 | 9.71 |
| Aug 2, 2020 | 9.67 |
| Jul 2, 2000 | 9.38 |
| Apr 23, 1999 | 9.19 |
| Feb 27, 2023 | 9.13 |
| May 18, 2020 | 8.97 |
| Apr 19, 1993 | 8.89 |
| Feb 20, 1994 | 8.78 |
| Aug 18, 1990 | 8.7 |
| Apr 9, 2015 | 8.28 |
| Apr 18, 2013 | 8.25 |
| Sep 18, 1972 | 8.23 |
| Sep 13, 1978 | 8.19 |
| Feb 9, 2001 | 8.18 |
| Mar 13, 2006 | 8.07 |
Data provided by the National Weather Service.