« Back to Jefferson County Rivers
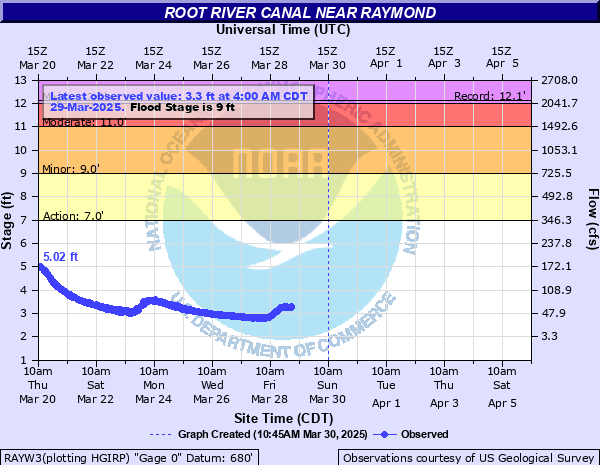
Root River Canal near Raymond
Critical Stages
7' - Action
9' - Flood
11' - Moderate
12' - Major
Latest Observation
Updated: 4:00 AM CST 12/8/25
Status: No Flooding
Stage: 2.03 ft
Flow: 0.0035 kcfs
Forecast
Forecast not available for this location.
| Time | Stage (ft) | Flow (kcfs) |
|---|---|---|
| 4:00 AM 12/8 | 2.03 | 0.0035 |
| 3:45 AM 12/8 | 2.03 | 0.0035 |
| 3:30 AM 12/8 | 2.03 | 0.0035 |
| 3:15 AM 12/8 | 2.03 | 0.0035 |
| 3:00 AM 12/8 | 2.03 | 0.0035 |
| 2:45 AM 12/8 | 2.03 | 0.0035 |
| 2:30 AM 12/8 | 2.03 | 0.0035 |
| 2:15 AM 12/8 | 2.03 | 0.0035 |
| 2:00 AM 12/8 | 2.03 | 0.0035 |
| 1:45 AM 12/8 | 2.03 | 0.0035 |
| 1:30 AM 12/8 | 2.03 | 0.0035 |
| 1:15 AM 12/8 | 2.03 | 0.0035 |
| 1:00 AM 12/8 | 2.03 | 0.0035 |
| 12:45 AM 12/8 | 2.03 | 0.0035 |
| 12:30 AM 12/8 | 2.03 | 0.0035 |
| 12:15 AM 12/8 | 2.03 | 0.0035 |
| 12:00 AM 12/8 | 2.03 | 0.0035 |
| 11:45 PM 12/7 | 2.02 | 0.0033 |
| 11:30 PM 12/7 | 2.02 | 0.0033 |
| 11:15 PM 12/7 | 2.02 | 0.0033 |
| 11:00 PM 12/7 | 2.03 | 0.0035 |
| 10:45 PM 12/7 | 2.03 | 0.0035 |
| 10:30 PM 12/7 | 2.02 | 0.0033 |
| 10:15 PM 12/7 | 2.02 | 0.0033 |
| 10:00 PM 12/7 | 2.03 | 0.0035 |
| 9:45 PM 12/7 | 2.02 | 0.0033 |
| 9:30 PM 12/7 | 2.02 | 0.0033 |
| 9:15 PM 12/7 | 2.03 | 0.0035 |
| 9:00 PM 12/7 | 2.02 | 0.0033 |
| 8:45 PM 12/7 | 2.02 | 0.0033 |
13' -
Homes are affected by floodwaters in the Town of Raymond. There is widespread flooding of lowland and agricultural land. Floodwaters cover a baseball diamond on 6 Mile Rd.
12' -
Floodwaters are in the back yards of some homes in the Town of Raymond. There is widespread lowland and agricultural land flooding. Floodwaters cover a baseball diamond on 6 Mile Rd.
11' -
Floodwaters are in the back yards of some homes in the Town of Raymond. There is widespread flooding of lowland and agricultural land. Floodwaters cover a baseball diamond on 6 Mile Road.
9' -
Water is over a baseball field near 6 Mile Road. Flooding of rural land and agricultural land.
8' -
There is minor lowland flooding.
7' -
There is minor lowland flooding.
| Date | Stage (ft) |
|---|---|
| Jun 9, 2008 | 12.13 |
| Aug 21, 2007 | 11.66 |
| May 23, 2004 | 11.28 |
| Feb 10, 2001 | 11.11 |
| May 18, 2020 | 10.98 |
| Jul 3, 2000 | 10.64 |
| Apr 30, 2020 | 10.58 |
| Apr 26, 2009 | 10.55 |
| Apr 27, 2008 | 10.55 |
| Dec 29, 2008 | 10.53 |
| Apr 18, 2013 | 10.47 |
| Apr 20, 1993 | 10.36 |
| May 15, 2018 | 10.35 |
| Jul 14, 2017 | 10.33 |
| Oct 2, 2018 | 10.3 |
| Apr 24, 1999 | 10.29 |
| Oct 2, 2018 | 10.28 |
| Apr 11, 2008 | 10.23 |
| May 11, 1990 | 10.11 |
| Mar 13, 2006 | 10.08 |
Data provided by the National Weather Service.