« Back to Jefferson County Rivers
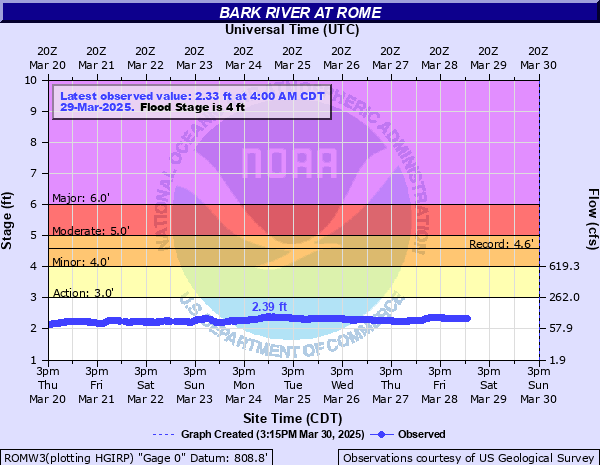
Bark River at Rome
Critical Stages
3' - Action
4' - Flood
5' - Moderate
6' - Major
Latest Observation
Updated: 4:00 AM CST 12/8/25
Status: No Flooding
Stage: 2 ft
Flow: 0.073 kcfs
Forecast
Forecast not available for this location.
| Time | Stage (ft) | Flow (kcfs) |
|---|---|---|
| 4:00 AM 12/8 | 2 | 0.073 |
| 3:45 AM 12/8 | 1.99 | 0.0714 |
| 3:30 AM 12/8 | 1.98 | 0.0698 |
| 3:15 AM 12/8 | 1.97 | 0.0682 |
| 3:00 AM 12/8 | 1.96 | 0.0667 |
| 2:45 AM 12/8 | 1.95 | 0.0652 |
| 2:30 AM 12/8 | 1.95 | 0.0652 |
| 2:15 AM 12/8 | 1.95 | 0.0652 |
| 2:00 AM 12/8 | 1.96 | 0.0667 |
| 1:45 AM 12/8 | 1.96 | 0.0667 |
| 1:30 AM 12/8 | 1.96 | 0.0667 |
| 1:15 AM 12/8 | 1.96 | 0.0667 |
| 1:00 AM 12/8 | 1.95 | 0.0652 |
| 12:45 AM 12/8 | 1.95 | 0.0652 |
| 12:30 AM 12/8 | 1.94 | 0.0637 |
| 12:15 AM 12/8 | 1.94 | 0.0637 |
| 12:00 AM 12/8 | 1.95 | 0.0652 |
| 11:45 PM 12/7 | 1.95 | 0.0652 |
| 11:30 PM 12/7 | 1.96 | 0.0667 |
| 11:15 PM 12/7 | 1.96 | 0.0667 |
| 11:00 PM 12/7 | 1.96 | 0.0667 |
| 10:45 PM 12/7 | 1.96 | 0.0667 |
| 10:30 PM 12/7 | 1.96 | 0.0667 |
| 10:15 PM 12/7 | 1.96 | 0.0667 |
| 10:00 PM 12/7 | 1.96 | 0.0667 |
| 9:45 PM 12/7 | 1.97 | 0.0682 |
| 9:30 PM 12/7 | 1.97 | 0.0682 |
| 9:15 PM 12/7 | 1.98 | 0.0698 |
| 9:00 PM 12/7 | 1.98 | 0.0698 |
| 8:45 PM 12/7 | 1.98 | 0.0698 |
5' -
Floodwaters affect agricultural land and wooded land.
4.67' -
Floodwaters affect mainly wooded land and agricultural land.
4.28' -
There is lowland and agricultural land flooding.
4.1' -
There is lowland and agricultural land flooding.
3.92' -
There is lowland and agricultural land flooding.
3.38' -
There is minor lowland flooding.
3.26' -
There is minor lowland flooding.
3.03' -
There is minor lowland flooding.
| Date | Stage (ft) |
|---|---|
| Jan 19, 2022 | 5.07 |
| Jun 9, 2008 | 4.59 |
| Dec 23, 2022 | 4.21 |
| Jan 21, 2019 | 4.15 |
| Jan 21, 2019 | 4.15 |
| Apr 18, 2013 | 3.74 |
| May 13, 2014 | 3.73 |
| Mar 14, 2019 | 3.48 |
| Dec 15, 2010 | 3.34 |
| Feb 25, 2018 | 3.27 |
| Jul 22, 2017 | 3.21 |
| Oct 2, 2019 | 3.06 |
| Dec 19, 0015 | 2.92 |
| Apr 11, 2015 | 2.86 |
| Mar 16, 2012 | 2.78 |
| Mar 12, 2021 | 2.72 |
| Apr 20, 1993 | 2.56 |
| Jul 27, 2010 | 2.55 |
| Aug 23, 2007 | 2.52 |
| Feb 5, 1996 | 2.45 |
Data provided by the National Weather Service.