« Back to Jefferson County Rivers
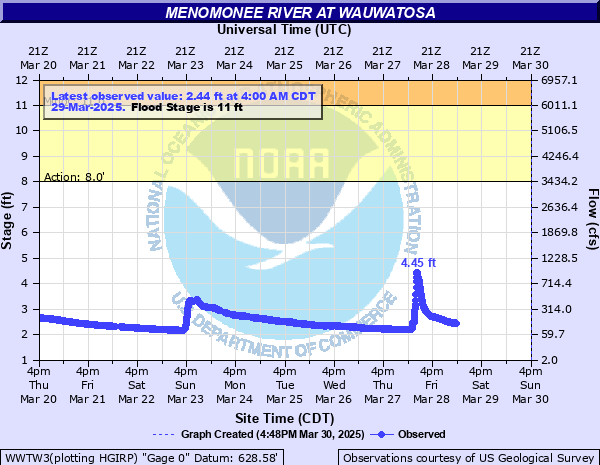
Menomonee River at Wauwatosa
Critical Stages
8' - Action
11' - Flood
15' - Moderate
18' - Major
Latest Observation
Updated: 4:00 AM CST 12/8/25
Status: No Flooding
Stage: 1.72 ft
Flow: 0.0331 kcfs
Forecast
Forecast not available for this location.
| Time | Stage (ft) | Flow (kcfs) |
|---|---|---|
| 4:00 AM 12/8 | 1.72 | 0.0331 |
| 3:55 AM 12/8 | 1.72 | 0.0331 |
| 3:50 AM 12/8 | 1.72 | 0.0331 |
| 3:45 AM 12/8 | 1.72 | 0.0331 |
| 3:40 AM 12/8 | 1.72 | 0.0331 |
| 3:35 AM 12/8 | 1.72 | 0.0331 |
| 3:30 AM 12/8 | 1.71 | 0.0321 |
| 3:25 AM 12/8 | 1.71 | 0.0321 |
| 3:20 AM 12/8 | 1.71 | 0.0321 |
| 3:15 AM 12/8 | 1.71 | 0.0321 |
| 3:10 AM 12/8 | 1.71 | 0.0321 |
| 3:05 AM 12/8 | 1.71 | 0.0321 |
| 3:00 AM 12/8 | 1.71 | 0.0321 |
| 2:55 AM 12/8 | 1.71 | 0.0321 |
| 2:50 AM 12/8 | 1.71 | 0.0321 |
| 2:45 AM 12/8 | 1.71 | 0.0321 |
| 2:40 AM 12/8 | 1.71 | 0.0321 |
| 2:35 AM 12/8 | 1.71 | 0.0321 |
| 2:30 AM 12/8 | 1.71 | 0.0321 |
| 2:25 AM 12/8 | 1.71 | 0.0321 |
| 2:20 AM 12/8 | 1.71 | 0.0321 |
| 2:15 AM 12/8 | 1.71 | 0.0321 |
| 2:10 AM 12/8 | 1.71 | 0.0321 |
| 2:05 AM 12/8 | 1.71 | 0.0321 |
| 2:00 AM 12/8 | 1.71 | 0.0321 |
| 1:55 AM 12/8 | 1.71 | 0.0321 |
| 1:50 AM 12/8 | 1.71 | 0.0321 |
| 1:45 AM 12/8 | 1.71 | 0.0321 |
| 1:40 AM 12/8 | 1.71 | 0.0321 |
| 1:35 AM 12/8 | 1.71 | 0.0321 |
19' -
The river is well out of its banks and causing some flooding of nearby homes.
18' -
The river is well out of its banks and causing some flooding to nearby homes.
17' -
The river is well out of its banks and causing flooding to some homes.
15' -
The river is out of its banks and causing some flooding to nearby homes.
14' -
The river is well out if its banks causing some flooding to homes.
13' -
The river is out of its banks and flooding surrounding lowland.
11' -
The river is well out of its banks and flooding surrounding lowland.
10' -
There is minor lowland flooding.
9' -
There is minor lowland flooding.
8' -
There is minor lowland flooding.
| Date | Stage (ft) |
|---|---|
| Jun 21, 1997 | 18.63 |
| Aug 6, 1998 | 18.3 |
| Jun 7, 2008 | 15.68 |
| Jun 19, 2009 | 15.34 |
| Jul 22, 2010 | 14.65 |
| Aug 10, 2025 | 14.54 |
| Jul 15, 2010 | 13.95 |
| Apr 21, 1973 | 13.92 |
| Aug 6, 1986 | 13.13 |
| Jul 21, 1999 | 13 |
| Jul 2, 2000 | 12.48 |
| Jul 4, 2004 | 11.8 |
| Aug 8, 2021 | 10.99 |
| Jul 9, 2006 | 10.84 |
| Aug 17, 1983 | 10.55 |
| Aug 3, 1994 | 10.43 |
| May 17, 2020 | 10.42 |
| Sep 18, 1972 | 10.39 |
| Aug 12, 2002 | 10.37 |
| Sep 7, 2016 | 10.21 |
Data provided by the National Weather Service.