Arkansas River at Salida
Critical Stages
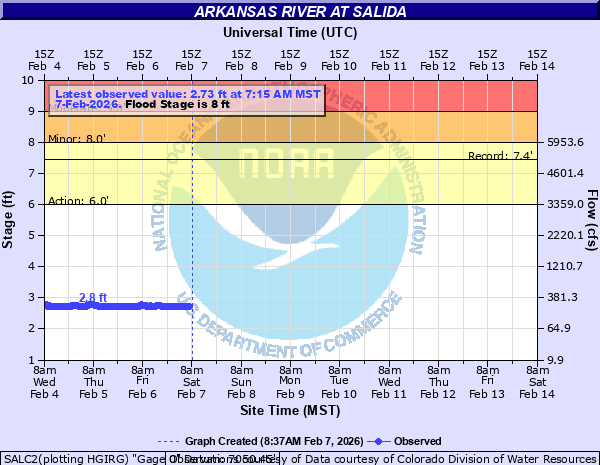
6' - Action
8' - Flood
9' - Moderate
10' - Major
Latest Observation
Updated: 11:15 AM MST 12/6/25
Status: No Flooding
Stage: 2.78 ft
Flow: 0.227 kcfs
Forecast
Forecast not available for this location.
| Time | Stage (ft) | Flow (kcfs) |
|---|---|---|
| 11:15 AM 12/6 | 2.78 | 0.227 |
| 11:00 AM 12/6 | 2.78 | 0.227 |
| 10:45 AM 12/6 | 2.78 | 0.227 |
| 10:30 AM 12/6 | 2.79 | 0.233 |
| 10:15 AM 12/6 | 2.79 | 0.233 |
| 10:00 AM 12/6 | 2.79 | 0.233 |
| 9:45 AM 12/6 | 2.79 | 0.233 |
| 9:30 AM 12/6 | 2.79 | 0.233 |
| 9:15 AM 12/6 | 2.8 | 0.239 |
| 9:00 AM 12/6 | 2.8 | 0.239 |
| 8:45 AM 12/6 | 2.8 | 0.239 |
| 8:30 AM 12/6 | 2.8 | 0.239 |
| 8:15 AM 12/6 | 2.8 | 0.239 |
| 8:00 AM 12/6 | 2.81 | 0.246 |
| 7:45 AM 12/6 | 2.81 | 0.246 |
| 7:30 AM 12/6 | 2.81 | 0.246 |
| 7:15 AM 12/6 | 2.81 | 0.246 |
| 7:00 AM 12/6 | 2.81 | 0.246 |
| 6:45 AM 12/6 | 2.81 | 0.246 |
| 6:30 AM 12/6 | 2.81 | 0.246 |
| 6:15 AM 12/6 | 2.81 | 0.246 |
| 6:00 AM 12/6 | 2.81 | 0.246 |
| 5:45 AM 12/6 | 2.81 | 0.246 |
| 5:30 AM 12/6 | 2.81 | 0.246 |
| 5:15 AM 12/6 | 2.81 | 0.246 |
| 5:00 AM 12/6 | 2.81 | 0.246 |
| 4:45 AM 12/6 | 2.8 | 0.239 |
| 4:30 AM 12/6 | 2.8 | 0.239 |
| 4:15 AM 12/6 | 2.8 | 0.239 |
| 4:00 AM 12/6 | 2.8 | 0.239 |
13.5' -
Major Flood. Flood waters are street level at F Street Bridge.
10' -
Major Flood. Water threatens homes along the river.
9.5' -
Moderate Flood. Water begins to flood residential properties in low lying areas upstream of F Street Bridge.
9' -
Moderate Flood. Waters rise into buildings at F Street Bridge.
8.5' -
Minor Flood. Water reaches base of F Street Bridge.
8' -
Minor Flood. Water reaches lowest railroad tracks west of F Street Bridge.
7.5' -
Action Stage. Water rises over low spots in path under Highway 291 Bridge.
6' -
Action Stage. Water rises over the road into a farm near the confluence with the South Fork of the Arkansas River.
5.5' -
The river is bankfull.
| Date | Stage (ft) |
|---|---|
| Jun 18, 2015 | 7.43 |
| Jun 6, 2010 | 6.97 |
| Jun 9, 2024 | 6.95 |
| Jun 15, 2019 | 6.74 |
| Jun 20, 2008 | 6.52 |
| Jun 20, 2017 | 6.39 |
| Jun 4, 2014 | 6.37 |
| Jul 10, 2011 | 6.28 |
| Aug 11, 2006 | 5.9 |
| Jun 27, 2009 | 5.79 |
Data provided by the National Weather Service.