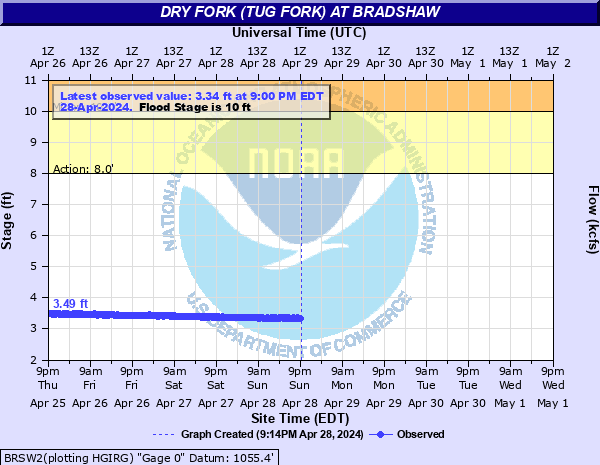
Dry Fork (Tug Fork) at Bradshaw
Critical Stages
8' - Action
10' - Flood
15' - Moderate
19' - Major
Latest Observation
Updated: 11:00 PM EST 12/16/25
Status: No Flooding
Stage: 2.92 ft
Flow: 0.0588 kcfs
Forecast
Forecast not available for this location.
| Time | Stage (ft) | Flow (kcfs) |
|---|---|---|
| 11:00 PM 12/16 | 2.92 | 0.0588 |
| 10:45 PM 12/16 | 2.92 | 0.0588 |
| 10:30 PM 12/16 | 2.92 | 0.0588 |
| 10:15 PM 12/16 | 2.92 | 0.0588 |
| 10:00 PM 12/16 | 2.91 | 0.0578 |
| 9:45 PM 12/16 | 2.91 | 0.0578 |
| 9:30 PM 12/16 | 2.9 | 0.0568 |
| 9:15 PM 12/16 | 2.9 | 0.0568 |
| 9:00 PM 12/16 | 2.9 | 0.0568 |
| 8:45 PM 12/16 | 2.9 | 0.0568 |
| 8:30 PM 12/16 | 2.9 | 0.0568 |
| 8:15 PM 12/16 | 2.91 | 0.0578 |
| 8:00 PM 12/16 | 2.91 | 0.0578 |
| 7:45 PM 12/16 | 2.91 | 0.0578 |
| 7:30 PM 12/16 | 2.92 | 0.0588 |
| 7:15 PM 12/16 | 2.92 | 0.0588 |
| 7:00 PM 12/16 | 2.91 | 0.0578 |
| 6:45 PM 12/16 | 2.9 | 0.0568 |
| 6:30 PM 12/16 | 2.89 | 0.0559 |
| 6:15 PM 12/16 | 2.87 | 0.0539 |
| 6:00 PM 12/16 | 2.86 | 0.053 |
| 5:45 PM 12/16 | 2.84 | 0.0511 |
| 5:30 PM 12/16 | 2.83 | 0.0502 |
| 5:15 PM 12/16 | 2.82 | 0.0492 |
| 5:00 PM 12/16 | 2.81 | 0.0483 |
| 4:45 PM 12/16 | 2.8 | 0.0474 |
| 4:30 PM 12/16 | 2.79 | 0.0466 |
| 4:15 PM 12/16 | 2.79 | 0.0466 |
| 4:00 PM 12/16 | 2.79 | 0.0466 |
| 3:45 PM 12/16 | 2.79 | 0.0466 |
20' -
State Route 80 begins to flood.
19' -
Between 19 and 22 feet, homes are flooded along the river.
15' -
Between 15 to 19 feet, some homes in lower areas are flooded along the river.
10' -
Between 10 and 15 feet, homes along the river downstream of the gage will start to flood.
| Date | Stage (ft) |
|---|---|
| Feb 16, 2025 | 18.16 |
| May 2, 2002 | 15.21 |
| Feb 6, 2020 | 13.51 |
| May 7, 1984 | 13.25 |
| Jul 13, 2022 | 12.71 |
| Mar 1, 2021 | 12.39 |
| Feb 17, 2023 | 12.31 |
| Feb 11, 2018 | 12.31 |
| Mar 5, 2015 | 12.28 |
| Nov 19, 2003 | 12.03 |
| Jan 31, 2013 | 11.41 |
| Apr 17, 1998 | 10.86 |
| Jan 2, 2022 | 10.85 |
| Feb 1, 2025 | 10.71 |
| Feb 23, 2003 | 10.6 |
| Apr 16, 2018 | 10.5 |
| Jul 31, 2020 | 10.36 |
| Dec 22, 2018 | 10.29 |
| May 16, 1996 | 10.26 |
| Apr 26, 2012 | 10.25 |
Data provided by the National Weather Service.