Anchor River at Anchor Point
Critical Stages
13.5' - Action
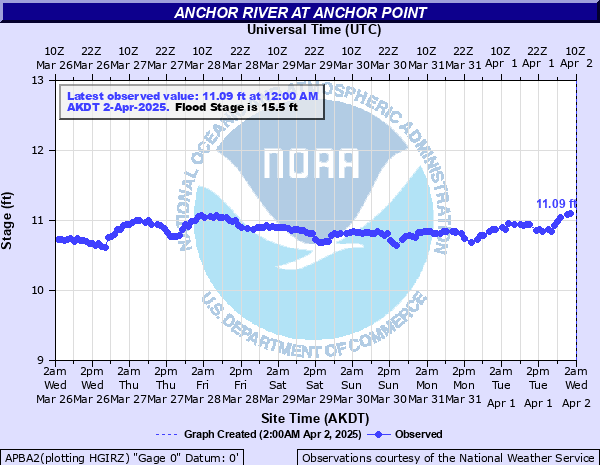
15.5' - Flood
17' - Moderate
18' - Major
Latest Observation
Updated: 2:00 PM LMT 1/1/01
Status: Obs Not Current
Stage: -999 ft
Flow: -999 kcfs
Forecast
Forecast not available for this location.
| Time | Stage (ft) | Flow (kcfs) |
|---|---|---|
| 7:00 PM 12/15 | 13.83 | 3.15 |
| 3:00 PM 12/14 | 13.7 | 2.96 |
| 3:00 PM 12/13 | 13.18 | 2.3 |
| 7:00 PM 12/12 | 12.75 | 1.81 |
| 3:00 PM 12/11 | 12.17 | 1.27 |
| 3:00 PM 12/10 | 11.36 | 0.823 |
| 3:00 PM 12/8 | 11.01 | 0.654 |
| 3:00 PM 12/7 | 10.81 | 0.566 |
| 3:00 PM 12/6 | 10.78 | 0.554 |
| 3:00 PM 12/5 | 11.07 | 0.681 |
| 3:00 PM 12/4 | 11.26 | 0.771 |
| 3:00 PM 12/3 | 11.39 | 0.839 |
| 3:00 PM 12/2 | 11.6 | 0.946 |
| 10:00 PM 12/1 | 11.65 | 0.97 |
| 5:00 PM 11/30 | 11.52 | 0.909 |
| 10:00 PM 11/29 | 11.52 | 0.909 |
| 7:00 PM 11/28 | 12.28 | 1.36 |
| 3:00 PM 11/27 | 12.33 | 1.4 |
| 5:00 PM 11/26 | 12.07 | 1.2 |
| 5:00 PM 11/25 | 11.66 | 0.975 |
| 3:00 PM 11/24 | 11.14 | 0.713 |
| 5:00 PM 11/23 | 11 | 0.65 |
| 5:00 PM 11/22 | 11.11 | 0.699 |
| 3:00 AM 11/22 | 11.34 | 0.812 |
| 3:00 PM 11/20 | 11.31 | 0.797 |
| 5:00 PM 11/19 | 11.1 | 0.695 |
| 5:00 PM 11/18 | 11.44 | 0.866 |
| 3:00 PM 11/17 | 11.34 | 0.812 |
| 5:00 PM 11/16 | 11.19 | 0.737 |
18' -
Water flooding entire campground and several cabins downstream of the gage.
17.5' -
Water is at the foundation of Tackle Shop, just DS of gage.
17' -
Moderate flood stage. Widespread flooding of roadways is likely. The New Sterling Highway near mile 160 may have water encroaching on it.
16' -
Anchor Point Road near the Old Sterling Highway Floods with 6-8 inches of water. Campground near the Old Sterling Highway floods with water up to 1 foot deep.
15.5' -
Water starts to flood Anchor Point State Recreation area and Campground downstream of the New Sterling Highway Bridge.
14.5' -
Bankfull stage.
13.5' -
Action stage.
| Date | Stage (ft) |
|---|---|
| Dec 30, 2015 | 20.83 |
| Apr 21, 2021 | 20.67 |
| Oct 24, 2002 | 19.15 |
| Jan 20, 1961 | 18.5 |
| Dec 10, 2019 | 17.75 |
| Mar 7, 1963 | 16.9 |
| Jan 2, 2019 | 16.38 |
| Apr 20, 1996 | 15.5 |
| Dec 13, 2017 | 15.46 |
| Nov 30, 1983 | 15.41 |
| Oct 23, 1980 | 14.98 |
| Apr 22, 2011 | 14.67 |
| May 4, 1976 | 14.63 |
| Apr 6, 1964 | 14.4 |
| May 5, 1985 | 14.15 |
| Oct 11, 1986 | 14.1 |
| Apr 24, 1959 | 13.85 |
| Apr 17, 1989 | 13.83 |
| Sep 22, 2016 | 13.77 |
| Nov 2, 2016 | 13.5 |
Data provided by the National Weather Service.