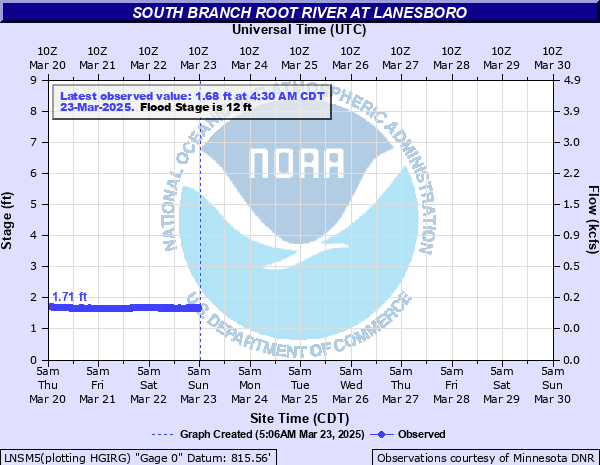
South Branch Root River at Lanesboro
Critical Stages
10' - Action
12' - Flood
16' - Moderate
18' - Major
Latest Observation
Updated: 8:30 PM CST 12/15/25
Status: No Flooding
Stage: 1.97 ft
Flow: 0.168 kcfs
Forecast
Forecast not available for this location.
| Time | Stage (ft) | Flow (kcfs) |
|---|---|---|
| 8:30 PM 12/15 | 1.97 | 0.168 |
| 8:15 PM 12/15 | 1.98 | 0.17 |
| 8:00 PM 12/15 | 1.99 | 0.171 |
| 7:45 PM 12/15 | 2 | 0.173 |
| 7:30 PM 12/15 | 2.01 | 0.175 |
| 7:15 PM 12/15 | 2.03 | 0.178 |
| 7:00 PM 12/15 | 2.03 | 0.178 |
| 6:45 PM 12/15 | 2.04 | 0.179 |
| 6:30 PM 12/15 | 2.04 | 0.179 |
| 6:15 PM 12/15 | 2.04 | 0.179 |
| 6:00 PM 12/15 | 2.04 | 0.179 |
| 5:45 PM 12/15 | 2.04 | 0.179 |
| 5:30 PM 12/15 | 2.03 | 0.178 |
| 5:15 PM 12/15 | 2.02 | 0.176 |
| 5:00 PM 12/15 | 2.02 | 0.176 |
| 4:45 PM 12/15 | 2.01 | 0.175 |
| 4:30 PM 12/15 | 2.01 | 0.175 |
| 4:15 PM 12/15 | 2 | 0.173 |
| 4:00 PM 12/15 | 1.99 | 0.171 |
| 3:45 PM 12/15 | 1.98 | 0.17 |
| 3:30 PM 12/15 | 1.97 | 0.168 |
| 3:15 PM 12/15 | 1.97 | 0.168 |
| 3:00 PM 12/15 | 1.96 | 0.167 |
| 2:45 PM 12/15 | 1.96 | 0.167 |
| 2:30 PM 12/15 | 1.96 | 0.167 |
| 2:15 PM 12/15 | 1.95 | 0.165 |
| 2:00 PM 12/15 | 1.94 | 0.163 |
| 1:45 PM 12/15 | 1.93 | 0.162 |
| 1:30 PM 12/15 | 1.93 | 0.162 |
| 1:15 PM 12/15 | 1.92 | 0.16 |
18' -
The river overflows the right bank downstream from the gage site. "The Flat" area is flooded and water begins to threaten some of the businesses downstream from the gage.
14' -
The river may begin to threaten "The Flat" area at this level and the ballfield will begin to experience some flooding.
12' -
The river begins to overflow the left bank downstream from the foot bridge where the gage is located.
| Date | Stage (ft) |
|---|---|
| Mar 26, 1950 | 19.2 |
| Jun 29, 1942 | 17.23 |
| Jun 9, 2008 | 14.17 |
| Jun 23, 2013 | 13.75 |
| Mar 26, 1961 | 13.73 |
| Mar 12, 1976 | 13.42 |
| Jun 1, 2000 | 13.21 |
| Mar 31, 1952 | 12.2 |
| Mar 30, 1979 | 12.05 |
| Apr 1, 1993 | 12 |
| May 30, 1980 | 11.95 |
| Jul 11, 2000 | 11.87 |
| Mar 14, 2019 | 11.86 |
| Apr 8, 2001 | 11.58 |
| Jun 21, 1974 | 11.08 |
| Sep 22, 2016 | 10.7 |
| Jul 7, 1978 | 10.45 |
| Jun 17, 1984 | 10.24 |
| Jun 17, 2004 | 9.99 |
| Mar 14, 2007 | 9.811 |
Data provided by the National Weather Service.