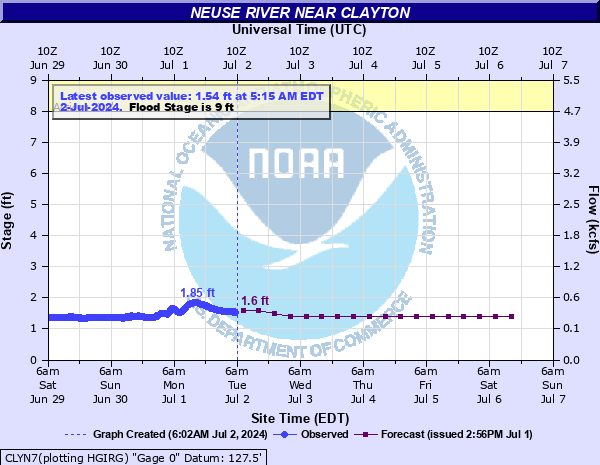
Neuse River near Clayton
Critical Stages
8' - Action
9' - Flood
13' - Moderate
16' - Major
Latest Observation
Updated: 3:15 PM EST 12/15/25
Status: No Flooding
Stage: 1.34 ft
Flow: 0.236 kcfs
Forecast
| Time | Stage (ft) | Flow (kcfs) |
|---|---|---|
| 7 PM 12/15 | 1.3 | 0.216 |
| 1 AM 12/16 | 1.3 | 0.216 |
| 7 AM 12/16 | 1.3 | 0.216 |
| 1 PM 12/16 | 1.3 | 0.216 |
| 7 PM 12/16 | 1.3 | 0.216 |
| 1 AM 12/17 | 1.3 | 0.216 |
| 7 AM 12/17 | 1.3 | 0.216 |
| 1 PM 12/17 | 1.3 | 0.216 |
| 7 PM 12/17 | 1.3 | 0.216 |
| 1 AM 12/18 | 1.3 | 0.216 |
| 7 AM 12/18 | 1.2 | 0.17 |
| 1 PM 12/18 | 1.2 | 0.17 |
| 7 PM 12/18 | 1.2 | 0.17 |
| 1 AM 12/19 | 1.2 | 0.17 |
| 7 AM 12/19 | 1.2 | 0.17 |
| 1 PM 12/19 | 1.2 | 0.17 |
| 7 PM 12/19 | 1.2 | 0.17 |
| 1 AM 12/20 | 1.2 | 0.17 |
| 7 AM 12/20 | 1.2 | 0.17 |
| Time | Stage (ft) | Flow (kcfs) |
|---|---|---|
| 3:15 PM 12/15 | 1.34 | 0.236 |
| 3:00 PM 12/15 | 1.34 | 0.236 |
| 2:45 PM 12/15 | 1.34 | 0.236 |
| 2:30 PM 12/15 | 1.33 | 0.231 |
| 2:15 PM 12/15 | 1.33 | 0.231 |
| 2:00 PM 12/15 | 1.34 | 0.236 |
| 1:45 PM 12/15 | 1.34 | 0.236 |
| 1:30 PM 12/15 | 1.33 | 0.231 |
| 1:15 PM 12/15 | 1.34 | 0.236 |
| 1:00 PM 12/15 | 1.34 | 0.236 |
| 12:45 PM 12/15 | 1.34 | 0.236 |
| 12:30 PM 12/15 | 1.34 | 0.236 |
| 12:15 PM 12/15 | 1.34 | 0.236 |
| 12:00 PM 12/15 | 1.33 | 0.231 |
| 11:45 AM 12/15 | 1.35 | 0.242 |
| 11:30 AM 12/15 | 1.35 | 0.242 |
| 11:15 AM 12/15 | 1.34 | 0.236 |
| 11:00 AM 12/15 | 1.35 | 0.242 |
| 10:45 AM 12/15 | 1.35 | 0.242 |
| 10:30 AM 12/15 | 1.35 | 0.242 |
| 10:15 AM 12/15 | 1.35 | 0.242 |
| 10:00 AM 12/15 | 1.35 | 0.242 |
| 9:45 AM 12/15 | 1.35 | 0.242 |
| 9:30 AM 12/15 | -9999 | -999 |
| 9:15 AM 12/15 | 1.35 | 0.242 |
| 9:00 AM 12/15 | 1.34 | 0.236 |
| 8:45 AM 12/15 | 1.35 | 0.242 |
| 8:30 AM 12/15 | 1.35 | 0.242 |
| 8:15 AM 12/15 | 1.35 | 0.242 |
| 8:00 AM 12/15 | 1.35 | 0.242 |
26' -
The grounds of the pumping station begin to flood.
22' -
Flooding reaches the lower concrete span of the bridge on Covered Bridge Road.
18' -
Castleberry Road off NC-42 is flooded and flood waters approach the entrance to East Clayton Elementary School.
16' -
Major flooding begins.
13' -
Flooding will close the Neuse River Greenway trail.
10' -
Upstream of the gage site, the Neuse River Greenway at Covered Bridge Road begins to flood.
9' -
Minor flooding begins. Minor overflow occurs on both banks. Water reaches the edge of the Neuse River Greenway trail.
| Date | Stage (ft) |
|---|---|
| Sep 19, 1945 | 22.12 |
| Oct 3, 1929 | 21.62 |
| Jul 23, 1919 | 21.15 |
| Sep 17, 1999 | 20.67 |
| Oct 9, 2016 | 20.48 |
| Sep 7, 1996 | 20.12 |
| Apr 26, 2017 | 19.31 |
| Dec 1, 1934 | 18.7 |
| Mar 20, 1975 | 18.32 |
| Feb 4, 1973 | 17.93 |
| Sep 20, 1928 | 17.5 |
| May 8, 1958 | 16.4 |
| Mar 3, 1929 | 16.22 |
| Jun 15, 2006 | 16.1 |
| Jan 24, 1954 | 16.1 |
| Mar 5, 1952 | 15.72 |
| Apr 8, 1936 | 15.4 |
| Feb 11, 1939 | 15.23 |
| Jun 19, 1967 | 15.13 |
| Jul 30, 1938 | 15.01 |
Data provided by the National Weather Service.