East Branch Delaware River at Harvard
Critical Stages
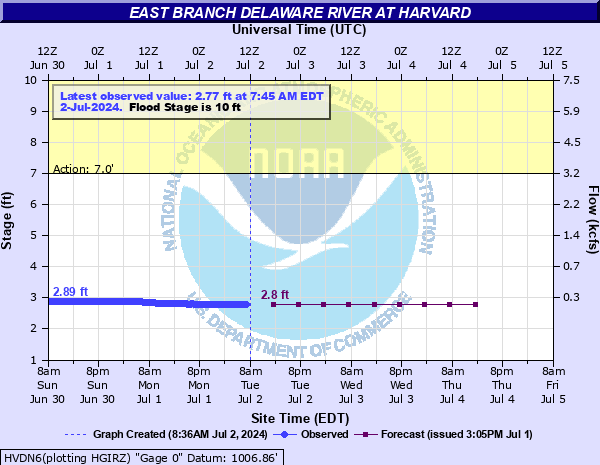
7' - Action
10' - Flood
12' - Moderate
15' - Major
Latest Observation
Updated: 9:45 PM EST 12/6/25
Status: No Flooding
Stage: 2.62 ft
Flow: 0.163 kcfs
Forecast
| Time | Stage (ft) | Flow (kcfs) |
|---|---|---|
| 1 AM 12/7 | 2.6 | 0.158 |
| 7 AM 12/7 | 2.6 | 0.158 |
| 1 PM 12/7 | 2.6 | 0.158 |
| 7 PM 12/7 | 2.6 | 0.158 |
| 1 AM 12/8 | 2.6 | 0.158 |
| 7 AM 12/8 | 2.6 | 0.158 |
| 1 PM 12/8 | 2.6 | 0.158 |
| 7 PM 12/8 | 2.6 | 0.158 |
| 1 AM 12/9 | 2.6 | 0.158 |
| 7 AM 12/9 | 2.6 | 0.158 |
| Time | Stage (ft) | Flow (kcfs) |
|---|---|---|
| 9:45 PM 12/6 | 2.62 | 0.163 |
| 9:30 PM 12/6 | 2.62 | 0.163 |
| 9:15 PM 12/6 | 2.62 | 0.163 |
| 9:00 PM 12/6 | 2.62 | 0.163 |
| 8:45 PM 12/6 | 2.63 | 0.165 |
| 8:30 PM 12/6 | 2.63 | 0.165 |
| 8:15 PM 12/6 | 2.63 | 0.165 |
| 8:00 PM 12/6 | 2.62 | 0.163 |
| 7:45 PM 12/6 | 2.62 | 0.163 |
| 7:30 PM 12/6 | 2.62 | 0.163 |
| 7:15 PM 12/6 | 2.62 | 0.163 |
| 7:00 PM 12/6 | 2.62 | 0.163 |
| 6:45 PM 12/6 | 2.62 | 0.163 |
| 6:30 PM 12/6 | 2.62 | 0.163 |
| 6:15 PM 12/6 | 2.62 | 0.163 |
| 6:00 PM 12/6 | 2.63 | 0.165 |
| 5:45 PM 12/6 | 2.63 | 0.165 |
| 5:30 PM 12/6 | 2.62 | 0.163 |
| 5:15 PM 12/6 | 2.62 | 0.163 |
| 5:00 PM 12/6 | 2.62 | 0.163 |
| 4:45 PM 12/6 | 2.63 | 0.165 |
| 4:30 PM 12/6 | 2.63 | 0.165 |
| 4:15 PM 12/6 | 2.62 | 0.163 |
| 4:00 PM 12/6 | 2.62 | 0.163 |
| 3:45 PM 12/6 | 2.63 | 0.165 |
| 3:30 PM 12/6 | 2.63 | 0.165 |
| 3:15 PM 12/6 | 2.62 | 0.163 |
| 3:00 PM 12/6 | 2.62 | 0.163 |
| 2:45 PM 12/6 | 2.62 | 0.163 |
| 2:30 PM 12/6 | 2.63 | 0.165 |
24.4' -
FEMA flood insurance maps indicate that a river level of 24.4 feet corresponds to the water elevation associated witih the 0.2 percent (500 year) flood risk zone. If your property is determined to be in this zone, then it is at high risk for flooding during a record flood event. This magnitude of flooding has a 0.2 percent chance of occurring in any year.
19.6' -
FEMA flood insurance maps indicate that a river level at 19.6 feet corresponds to the water elevation associated with the 1 percent (100 year) flood risk zone. If your property is determined to be in this zone, then it is at high risk for flooding during a record flood event. A flood of this magnitude has a 1 percent chance of occurring in any year.
16.93' -
This level, from September 1938, is the historic flood of record prior to the construction of Downsville Dam.
16.61' -
This is the flood level from June, 2006 and is the modern flood of record. Widespread flooding, resulting in catastrophic property and infrastructure damage, occurred from Downsville to East Branch.
16.32' -
This is the flood level from April, 2005 and is considered to be major flooding.
16.07' -
This is the flood level from September, 2004 and is considered to be major flooding.
15' -
Major flood stage. Above 15 feet, river flooding is widespread from Downsville to East Branch with several residential and commercial properties affected between Harvard Road and Route 30. Significant backwater flooding from Baxter Brook is also likely. River water crosses O and W Road between East Branch and Fishs Eddy. Evacuations typically begin throughout the Town of Colchester.
14.73' -
This is the flood level from the remnants of Tropical Storm Lee in September, 2011 and is considered to be moderate flooding.
13.31' -
This is the flood level from the remnants of Hurricane Irene in August, 2011 and is considered to be moderate flooding.
12.63' -
This is the flood level from January, 1996 and is considered to be moderate flooding.
12' -
Moderate Flood Stage. Between 12 and 15 feet, river flooding begins at the Oxbow Campground in Harvard. Significant backwater flooding from Baxter Brook is also likely. Residences along Harvard Road and Route 30 from Harvard to East Branch are threatened.
11' -
Harvard Road, Fox Lane and Harvard Cemetery Road become impassable in spots due to increasing river flooding. Camp cottage properties along Route 30 flood.
10' -
Minor flood stage. Low lying roads along the river from Downsville to East Branch begin to flood.
7' -
Island Road in the Town of Colchester is normally closed at this level.
| Date | Stage (ft) |
|---|---|
| Sep 22, 1938 | 16.93 |
| Jun 28, 2006 | 16.61 |
| Apr 3, 2005 | 16.32 |
| Sep 19, 2004 | 16.07 |
| Mar 22, 1948 | 15.75 |
| Nov 26, 1950 | 15.69 |
| Mar 18, 1936 | 15.58 |
| Mar 31, 1940 | 15.01 |
| Sep 8, 2011 | 14.73 |
| May 23, 1942 | 14.62 |
| Dec 31, 1948 | 14.47 |
| Dec 12, 1952 | 13.96 |
| Aug 29, 2011 | 13.31 |
| Dec 2, 1996 | 12.8 |
| Apr 8, 2022 | 12.76 |
| Feb 27, 1945 | 12.74 |
| Jan 20, 1996 | 12.63 |
| May 30, 1984 | 11.78 |
| Mar 9, 2008 | 11.69 |
| Dec 6, 1938 | 11.5 |
Data provided by the National Weather Service.