Genesee River at Avon - NEW USGS gage on the old railroad bridge
Critical Stages
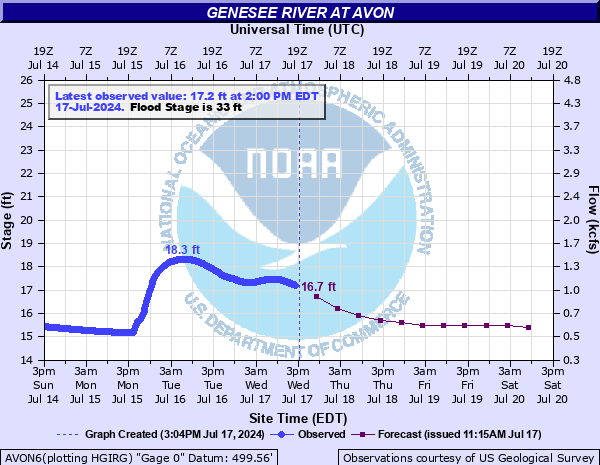
30' - Action
33' - Flood
37' - Moderate
40' - Major
Latest Observation
Updated: 6:15 AM EST 12/5/25
Status: No Flooding
Stage: 16.09 ft
Flow: 0.699 kcfs
Forecast
| Time | Stage (ft) | Flow (kcfs) |
|---|---|---|
| 1 PM 12/5 | 15.7 | 0.603 |
| 7 PM 12/5 | 15.7 | 0.603 |
| 1 AM 12/6 | 15.6 | 0.578 |
| 7 AM 12/6 | 15.6 | 0.578 |
| 1 PM 12/6 | 15.5 | 0.555 |
| 7 PM 12/6 | 15.5 | 0.555 |
| 1 AM 12/7 | 15.4 | 0.532 |
| 7 AM 12/7 | 15.4 | 0.532 |
| Time | Stage (ft) | Flow (kcfs) |
|---|---|---|
| 6:15 AM 12/5 | 16.09 | 0.699 |
| 6:00 AM 12/5 | 16.09 | 0.699 |
| 5:45 AM 12/5 | 16.09 | 0.699 |
| 5:30 AM 12/5 | 16.08 | 0.697 |
| 5:15 AM 12/5 | 16.08 | 0.697 |
| 5:00 AM 12/5 | 16.08 | 0.697 |
| 4:45 AM 12/5 | 16.08 | 0.697 |
| 4:30 AM 12/5 | 16.08 | 0.697 |
| 4:15 AM 12/5 | 16.08 | 0.697 |
| 4:00 AM 12/5 | 16.08 | 0.697 |
| 3:45 AM 12/5 | 16.09 | 0.699 |
| 3:30 AM 12/5 | 16.09 | 0.699 |
| 3:15 AM 12/5 | 16.1 | 0.702 |
| 3:00 AM 12/5 | 16.1 | 0.702 |
| 2:45 AM 12/5 | 16.11 | 0.705 |
| 2:30 AM 12/5 | 16.12 | 0.707 |
| 2:15 AM 12/5 | 16.12 | 0.707 |
| 2:00 AM 12/5 | 16.13 | 0.71 |
| 1:45 AM 12/5 | 16.13 | 0.71 |
| 1:30 AM 12/5 | 16.14 | 0.712 |
| 1:15 AM 12/5 | 16.14 | 0.712 |
| 1:00 AM 12/5 | 16.14 | 0.712 |
| 12:45 AM 12/5 | 16.15 | 0.715 |
| 12:30 AM 12/5 | 16.15 | 0.715 |
| 12:15 AM 12/5 | 16.15 | 0.715 |
| 12:00 AM 12/5 | 16.16 | 0.717 |
| 11:45 PM 12/4 | 16.16 | 0.717 |
| 11:30 PM 12/4 | 16.16 | 0.717 |
| 11:15 PM 12/4 | 16.16 | 0.717 |
| 11:00 PM 12/4 | 16.17 | 0.72 |
40' -
Major flood, widespread flooding of agricultural lands from Geneseo to Scottsville. Some residential and industrial areas threatened.
37' -
Moderate flood, more widespread flooding of agricultural lands from Geneseo to Scottsville. Residential areas begin to be threatened.
33' -
Flood stage, river overflows at many areas from Geneseo to Scottsville, but mainly in agricultural lands with little damage to structures.
30' -
Action stage, high flows, no flooding.
| Date | Stage (ft) |
|---|---|
| Jun 25, 1972 | 40.67 |
| Mar 7, 1956 | 37.2 |
| Jan 9, 1998 | 36.3 |
| Apr 14, 1994 | 34.59 |
| Apr 7, 1957 | 34.51 |
| Mar 15, 1964 | 34.5 |
| Sep 25, 1977 | 34.36 |
| Oct 30, 2021 | 34.31 |
| Nov 6, 2017 | 34.24 |
| Jan 19, 1996 | 34.24 |
| Apr 21, 2017 | 33.88 |
| Mar 18, 1973 | 33.73 |
| Apr 23, 1993 | 33.62 |
| Mar 6, 1979 | 33.42 |
| Feb 23, 2022 | 33.41 |
| Mar 31, 1960 | 33.41 |
| Apr 3, 2005 | 33.4 |
| Dec 31, 1990 | 33.27 |
Data provided by the National Weather Service.