Oatka Creek at Garbutt
Critical Stages
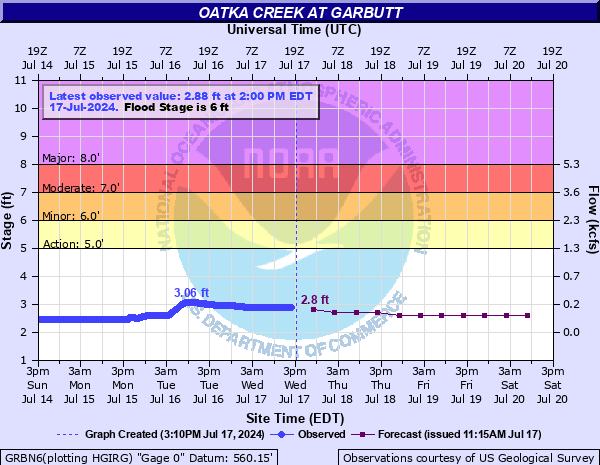
5' - Action
6' - Flood
7' - Moderate
8' - Major
Latest Observation
Updated: 6:00 AM EST 12/5/25
Status: No Flooding
Stage: 2.42 ft
Flow: 0.0417 kcfs
Forecast
| Time | Stage (ft) | Flow (kcfs) |
|---|---|---|
| 7 AM 12/5 | 2.4 | 0.039 |
| 1 PM 12/5 | 2.4 | 0.039 |
| 7 PM 12/5 | 2.4 | 0.039 |
| 1 AM 12/6 | 2.4 | 0.039 |
| 7 AM 12/6 | 2.4 | 0.039 |
| 1 PM 12/6 | 2.4 | 0.039 |
| 7 PM 12/6 | 2.4 | 0.039 |
| 1 AM 12/7 | 2.4 | 0.039 |
| 7 AM 12/7 | 2.4 | 0.039 |
| Time | Stage (ft) | Flow (kcfs) |
|---|---|---|
| 6:00 AM 12/5 | 2.42 | 0.0417 |
| 5:45 AM 12/5 | 2.43 | 0.0431 |
| 5:30 AM 12/5 | 2.43 | 0.0431 |
| 5:15 AM 12/5 | 2.43 | 0.0431 |
| 5:00 AM 12/5 | 2.43 | 0.0431 |
| 4:45 AM 12/5 | 2.43 | 0.0431 |
| 4:30 AM 12/5 | 2.43 | 0.0431 |
| 4:15 AM 12/5 | 2.44 | 0.0445 |
| 4:00 AM 12/5 | 2.44 | 0.0445 |
| 3:45 AM 12/5 | 2.44 | 0.0445 |
| 3:30 AM 12/5 | 2.44 | 0.0445 |
| 3:15 AM 12/5 | 2.44 | 0.0445 |
| 3:00 AM 12/5 | 2.44 | 0.0445 |
| 2:45 AM 12/5 | 2.44 | 0.0445 |
| 2:30 AM 12/5 | 2.44 | 0.0445 |
| 2:15 AM 12/5 | 2.44 | 0.0445 |
| 2:00 AM 12/5 | 2.44 | 0.0445 |
| 1:45 AM 12/5 | 2.44 | 0.0445 |
| 1:30 AM 12/5 | 2.44 | 0.0445 |
| 1:15 AM 12/5 | 2.44 | 0.0445 |
| 1:00 AM 12/5 | 2.44 | 0.0445 |
| 12:45 AM 12/5 | 2.44 | 0.0445 |
| 12:30 AM 12/5 | 2.44 | 0.0445 |
| 12:15 AM 12/5 | 2.44 | 0.0445 |
| 12:00 AM 12/5 | 2.44 | 0.0445 |
| 11:45 PM 12/4 | 2.44 | 0.0445 |
| 11:30 PM 12/4 | 2.44 | 0.0445 |
| 11:15 PM 12/4 | 2.44 | 0.0445 |
| 11:00 PM 12/4 | 2.44 | 0.0445 |
| 10:45 PM 12/4 | 2.44 | 0.0445 |
8' -
Major flood, extensive residential flooding along creek. Major damages in Mumford, Wheatland, Scottsville, and Garbutt. Roadways closed. Widespread agricultural flooding near the creek in Monroe and Genesee counties. Probable backwater effects from Genesee River.
7' -
Moderate flood, widespread flooding of agricultural lands below LeRoy. Significant residential flooding along creek, especially in Mumford, Wheatland, and Scottsville. Roadway flooding begins. Some backwater effects possible from Genesee River near Scottsville.
6' -
Flood stage, general flooding of agricultural land begins, some basement flooding in Scottsville and Garbutt.
5' -
Action stage, some minor overflow into agricultural lands near confluence with Genesee River. No damages.
| Date | Stage (ft) |
|---|---|
| Mar 31, 1960 | 8.64 |
| Jan 9, 1998 | 8.57 |
| Mar 29, 1950 | 8.52 |
| Mar 8, 1956 | 8.38 |
| Mar 5, 1976 | 8.18 |
| Mar 2, 1955 | 7.97 |
| Mar 31, 1993 | 7.83 |
| Mar 15, 2007 | 7.5 |
| Feb 25, 1985 | 7.39 |
| Feb 13, 2009 | 7.27 |
| Mar 6, 1979 | 7.19 |
| Dec 23, 2013 | 7.19 |
| Apr 4, 2005 | 7.04 |
| Jul 10, 1998 | 7 |
| Apr 6, 1984 | 6.91 |
| Jun 24, 1972 | 6.89 |
| Dec 29, 2008 | 6.85 |
| Apr 6, 1947 | 6.8 |
| Mar 23, 1978 | 6.8 |
| Jan 20, 1996 | 6.79 |
Data provided by the National Weather Service.