Cayuga Lake at Ithaca
Critical Stages
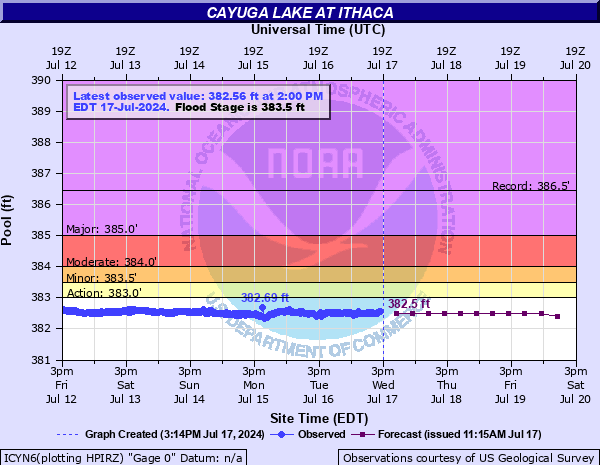
383' - Action
383.5' - Flood
384' - Moderate
385' - Major
Latest Observation
Updated: 6:00 AM EST 12/5/25
Status: No Flooding
Stage: 380.21 ft
Flow: -999 kcfs
Forecast
| Time | Stage (ft) | Flow (kcfs) |
|---|---|---|
| 1 PM 12/5 | 380.3 | -999 |
| 7 PM 12/5 | 380.3 | -999 |
| 1 AM 12/6 | 380.3 | -999 |
| 7 AM 12/6 | 380.3 | -999 |
| 1 PM 12/6 | 380.3 | -999 |
| 7 PM 12/6 | 380.3 | -999 |
| 1 AM 12/7 | 380.3 | -999 |
| 7 AM 12/7 | 380.3 | -999 |
| Time | Stage (ft) | Flow (kcfs) |
|---|---|---|
| 6:00 AM 12/5 | 380.21 | -999 |
| 5:45 AM 12/5 | 380.26 | -999 |
| 5:30 AM 12/5 | 380.26 | -999 |
| 5:15 AM 12/5 | 380.23 | -999 |
| 5:00 AM 12/5 | 380.23 | -999 |
| 4:45 AM 12/5 | 380.24 | -999 |
| 4:30 AM 12/5 | 380.26 | -999 |
| 4:15 AM 12/5 | 380.23 | -999 |
| 4:00 AM 12/5 | 380.2 | -999 |
| 3:45 AM 12/5 | 380.27 | -999 |
| 3:30 AM 12/5 | 380.25 | -999 |
| 3:15 AM 12/5 | 380.26 | -999 |
| 3:00 AM 12/5 | 380.25 | -999 |
| 2:45 AM 12/5 | 380.26 | -999 |
| 2:30 AM 12/5 | 380.25 | -999 |
| 2:15 AM 12/5 | 380.26 | -999 |
| 2:00 AM 12/5 | 380.25 | -999 |
| 1:45 AM 12/5 | 380.24 | -999 |
| 1:30 AM 12/5 | 380.3 | -999 |
| 1:15 AM 12/5 | 380.26 | -999 |
| 1:00 AM 12/5 | 380.29 | -999 |
| 12:45 AM 12/5 | 380.26 | -999 |
| 12:30 AM 12/5 | 380.31 | -999 |
| 12:15 AM 12/5 | 380.28 | -999 |
| 12:00 AM 12/5 | 380.32 | -999 |
| 11:45 PM 12/4 | 380.3 | -999 |
| 11:30 PM 12/4 | 380.3 | -999 |
| 11:15 PM 12/4 | 380.27 | -999 |
| 11:00 PM 12/4 | 380.31 | -999 |
| 10:45 PM 12/4 | 380.28 | -999 |
386.5' -
This is the approximate level during the April 1993 record snowmelt flood.
386.3' -
This is approximately the lake level during the June 1972 Hurricane Agnes major flood.
385' -
Significant flooding occurs around the lake. This level is approximately the same as the April 1916 and March 1936 floods. Wind waves will cause unusual land erosion and damage docks.
384' -
Water will affect some properties along the lake shore in the towns of Ulysses, Trumansburg and Lansing. No homes are flooded at this level. Parks near the lake may flood. Wind waves may cause unusual land erosion and damage docks.
383.5' -
The lake level is high enough to flood normally dry areas along the shoreline and may affect some paths, or roads nearest the shore.
| Date | Stage (ft) |
|---|---|
| Apr 26, 1993 | 386.46 |
| Jun 25, 1972 | 386.27 |
| Apr 5, 1916 | 385.12 |
| Mar 22, 1936 | 385.12 |
| Nov 2, 2021 | 384.75 |
| Jul 9, 1935 | 384.42 |
| May 4, 2020 | 384.34 |
| Jun 16, 2015 | 384.28 |
| Aug 23, 2021 | 384.26 |
| May 11, 2025 | 384.04 |
| May 9, 2017 | 383.74 |
| May 22, 2014 | 383.7 |
| Jun 22, 2019 | 383.5 |
Data provided by the National Weather Service.