Tioga River at Lindley
Critical Stages
14' - Action
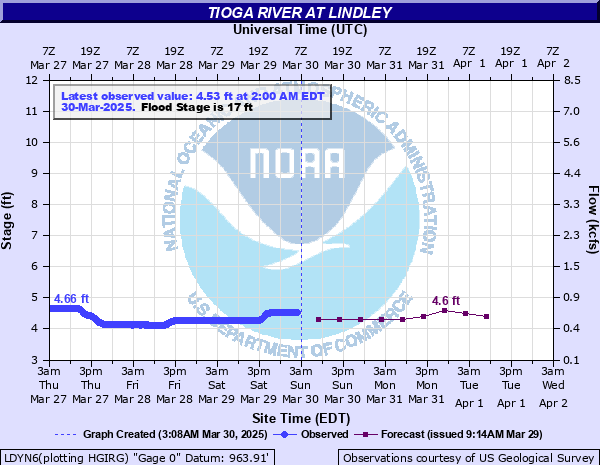
17' - Flood
20' - Moderate
22' - Major
Latest Observation
Updated: 6:00 AM EST 12/5/25
Status: No Flooding
Stage: 3.24 ft
Flow: 0.104 kcfs
Forecast
| Time | Stage (ft) | Flow (kcfs) |
|---|---|---|
| 7 AM 12/5 | 3.2 | 0.096 |
| 1 PM 12/5 | 3.2 | 0.096 |
| 7 PM 12/5 | 3.2 | 0.096 |
| 1 AM 12/6 | 3.2 | 0.096 |
| 7 AM 12/6 | 3.2 | 0.096 |
| 1 PM 12/6 | 3.2 | 0.096 |
| 7 PM 12/6 | 3.2 | 0.096 |
| 1 AM 12/7 | 3.2 | 0.096 |
| 7 AM 12/7 | 3.2 | 0.096 |
| Time | Stage (ft) | Flow (kcfs) |
|---|---|---|
| 6:00 AM 12/5 | 3.24 | 0.104 |
| 5:45 AM 12/5 | 3.24 | 0.104 |
| 5:30 AM 12/5 | 3.24 | 0.104 |
| 5:15 AM 12/5 | 3.24 | 0.104 |
| 5:00 AM 12/5 | 3.24 | 0.104 |
| 4:45 AM 12/5 | 3.24 | 0.104 |
| 4:30 AM 12/5 | 3.24 | 0.104 |
| 4:16 AM 12/5 | 3.24 | 0.104 |
| 4:15 AM 12/5 | 3.24 | 0.104 |
| 4:00 AM 12/5 | 3.24 | 0.104 |
| 3:45 AM 12/5 | 3.25 | 0.107 |
| 3:30 AM 12/5 | 3.25 | 0.107 |
| 3:15 AM 12/5 | 3.25 | 0.107 |
| 3:00 AM 12/5 | 3.25 | 0.107 |
| 2:45 AM 12/5 | 3.25 | 0.107 |
| 2:30 AM 12/5 | 3.25 | 0.107 |
| 2:15 AM 12/5 | 3.25 | 0.107 |
| 2:00 AM 12/5 | 3.25 | 0.107 |
| 1:45 AM 12/5 | 3.25 | 0.107 |
| 1:30 AM 12/5 | 3.25 | 0.107 |
| 1:15 AM 12/5 | 3.25 | 0.107 |
| 1:00 AM 12/5 | 3.25 | 0.107 |
| 12:45 AM 12/5 | 3.25 | 0.107 |
| 12:30 AM 12/5 | 3.25 | 0.107 |
| 12:15 AM 12/5 | 3.25 | 0.107 |
| 12:00 AM 12/5 | 3.25 | 0.107 |
| 11:45 PM 12/4 | 3.25 | 0.107 |
| 11:30 PM 12/4 | 3.25 | 0.107 |
| 11:15 PM 12/4 | 3.25 | 0.107 |
| 11:00 PM 12/4 | 3.25 | 0.107 |
26.27' -
Flood of Record. Tropical Storm "Agnes" June 23, 1972. Flooding in Lindley reached about the same extent as major flooding, but became much deeper. The Town of Lawrenceville, PA was nearly destroyed and the entire population was evacuated.
22' -
Severe flooding of homes and properties occurs between River Road and NY 115. Residences along Caroline Drive, Carnegie Drive, Lindley Road and Morgan Creek Road are inundated.
20' -
Flooding of properties and homes occurs along Lindley Road and Morgan Creek Road, extending inland to Caroline Drive and the northern end of Carriage Drive. Properties along River Road north of the bridge may be affected.
17' -
Water spreads out into agricultural areas alongside the river. Portions of Lindley Road and Morgan Creek Road become flooded.
| Date | Stage (ft) |
|---|---|
| Jun 23, 1972 | 26.27 |
| Sep 26, 1975 | 23.37 |
| May 28, 1946 | 22.87 |
| Oct 14, 1955 | 20.18 |
| Nov 29, 1950 | 19.9 |
| Mar 31, 1951 | 19.42 |
| Mar 12, 1936 | 19.2 |
| Mar 5, 1964 | 19.04 |
| Apr 1, 1940 | 18.78 |
| Mar 22, 1948 | 18.5 |
| Apr 5, 1947 | 18.48 |
| Mar 17, 1936 | 17.8 |
| Mar 11, 1952 | 17.71 |
| Dec 30, 1942 | 17.63 |
| Feb 26, 1961 | 17.48 |
| Mar 9, 1942 | 17.46 |
| Jan 22, 1959 | 17.33 |
| Mar 29, 1950 | 17.32 |
| Mar 31, 1960 | 17.32 |
| Nov 13, 1937 | 17.13 |
Data provided by the National Weather Service.