Tippecanoe River at Winamac
Critical Stages
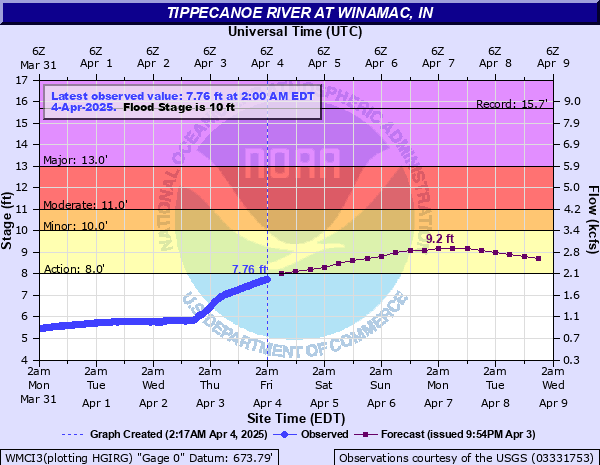
8' - Action
10' - Flood
11' - Moderate
13' - Major
Latest Observation
Updated: 7:00 PM EST 12/15/25
Status: No Flooding
Stage: 3.84 ft
Flow: 0.3 kcfs
Forecast
Forecast not available for this location.
| Time | Stage (ft) | Flow (kcfs) |
|---|---|---|
| 7:00 PM 12/15 | 3.84 | 0.3 |
| 6:45 PM 12/15 | 3.85 | 0.302 |
| 6:30 PM 12/15 | 3.85 | 0.302 |
| 6:15 PM 12/15 | 3.84 | 0.3 |
| 6:00 PM 12/15 | 3.83 | 0.297 |
| 5:45 PM 12/15 | 3.82 | 0.295 |
| 5:30 PM 12/15 | 3.81 | 0.293 |
| 5:15 PM 12/15 | 3.8 | 0.29 |
| 5:00 PM 12/15 | 3.79 | 0.288 |
| 4:45 PM 12/15 | 3.77 | 0.283 |
| 4:30 PM 12/15 | 3.76 | 0.28 |
| 4:15 PM 12/15 | 3.73 | 0.273 |
| 4:00 PM 12/15 | 3.69 | 0.264 |
| 3:45 PM 12/15 | 3.79 | 0.288 |
| 3:30 PM 12/15 | 4.03 | 0.35 |
| 3:15 PM 12/15 | 4.05 | 0.355 |
| 3:00 PM 12/15 | 3.91 | 0.317 |
| 2:45 PM 12/15 | 3.6 | 0.243 |
| 2:30 PM 12/15 | 3.65 | 0.254 |
| 2:15 PM 12/15 | 3.67 | 0.259 |
| 2:00 PM 12/15 | 3.68 | 0.261 |
| 1:45 PM 12/15 | 3.67 | 0.259 |
| 1:30 PM 12/15 | 3.67 | 0.259 |
| 1:15 PM 12/15 | 3.66 | 0.256 |
| 1:00 PM 12/15 | 3.65 | 0.254 |
| 12:45 PM 12/15 | 3.65 | 0.254 |
| 12:30 PM 12/15 | 3.63 | 0.249 |
| 12:15 PM 12/15 | 3.62 | 0.247 |
| 12:00 PM 12/15 | 3.61 | 0.245 |
| 11:45 AM 12/15 | 3.6 | 0.243 |
15.4' -
Record flooding is in progress.
13' -
Major flooding is in progress.
11.5' -
Houses and lots are flooded in eastern parts of Winamac near the State Route 14 bridge. Some evacuations become necessary. The campground and town park in Winamac are flooded.
11' -
Extensive residential flooding is in progress.
10' -
The river is at flood stage. Some residences begin to be affected by flood water and the Winamac town park floods.
9' -
Water approaches the road in Winamac town park.
| Date | Stage (ft) |
|---|---|
| Mar 14, 2009 | 15.69 |
| Feb 20, 1985 | 15.4 |
| Feb 24, 2018 | 15.16 |
| Feb 24, 2018 | 15.15 |
| Jan 11, 2008 | 15.11 |
| Mar 11, 1982 | 15 |
| Jun 13, 1981 | 15 |
| Jan 7, 1993 | 14.5 |
| Jan 16, 2005 | 13.63 |
| Jan 15, 2005 | 13.4 |
| Jul 22, 1996 | 13.2 |
| Jun 4, 2013 | 12.74 |
| Jun 19, 2015 | 12.59 |
| Oct 4, 1986 | 12.57 |
| Feb 25, 1990 | 12.5 |
| Apr 26, 1999 | 12.5 |
| Apr 30, 2011 | 12.28 |
| Apr 22, 2013 | 12.21 |
| May 15, 2002 | 12 |
| Apr 3, 1983 | 12 |
Data provided by the National Weather Service.