North Platte River at Lewellen
Critical Stages
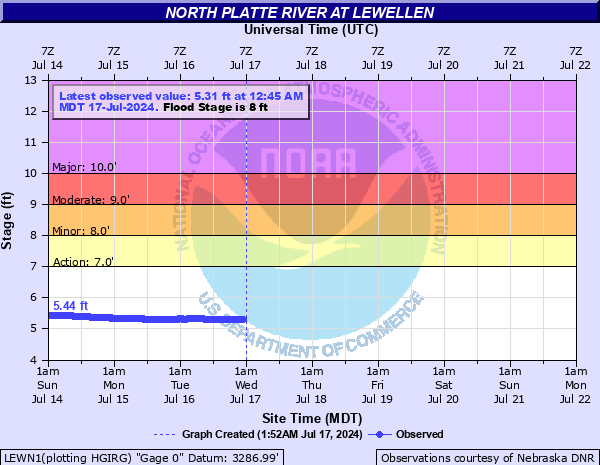
7' - Action
8' - Flood
9' - Moderate
10' - Major
Latest Observation
Updated: 8:45 PM MST 12/15/25
Status: No Flooding
Stage: 6.24 ft
Flow: 0.797 kcfs
Forecast
Forecast not available for this location.
| Time | Stage (ft) | Flow (kcfs) |
|---|---|---|
| 8:45 PM 12/15 | 6.24 | 0.797 |
| 8:30 PM 12/15 | 6.24 | 0.797 |
| 8:15 PM 12/15 | 6.24 | 0.797 |
| 8:00 PM 12/15 | 6.24 | 0.797 |
| 7:45 PM 12/15 | 6.23 | 0.79 |
| 7:30 PM 12/15 | 6.24 | 0.797 |
| 7:15 PM 12/15 | 6.24 | 0.797 |
| 7:00 PM 12/15 | 6.23 | 0.79 |
| 6:45 PM 12/15 | 6.24 | 0.797 |
| 6:30 PM 12/15 | 6.24 | 0.797 |
| 6:15 PM 12/15 | 6.24 | 0.797 |
| 6:00 PM 12/15 | 6.24 | 0.797 |
| 5:45 PM 12/15 | 6.24 | 0.797 |
| 5:30 PM 12/15 | 6.24 | 0.797 |
| 5:15 PM 12/15 | 6.24 | 0.797 |
| 5:00 PM 12/15 | 6.24 | 0.797 |
| 4:45 PM 12/15 | 6.24 | 0.797 |
| 4:30 PM 12/15 | 6.24 | 0.797 |
| 4:15 PM 12/15 | 6.25 | 0.804 |
| 4:00 PM 12/15 | 6.25 | 0.804 |
| 3:45 PM 12/15 | 6.25 | 0.804 |
| 3:30 PM 12/15 | 6.25 | 0.804 |
| 3:15 PM 12/15 | 6.24 | 0.797 |
| 3:00 PM 12/15 | 6.25 | 0.804 |
| 2:45 PM 12/15 | 6.24 | 0.797 |
| 2:30 PM 12/15 | 6.25 | 0.804 |
| 2:15 PM 12/15 | 6.25 | 0.804 |
| 2:00 PM 12/15 | 6.24 | 0.797 |
| 1:45 PM 12/15 | 6.25 | 0.804 |
| 1:30 PM 12/15 | 6.24 | 0.797 |
10' -
Major flood stage. Widespread flooding in southern portions of Lewellen. State Highway 26 may be impassable as river levels increase.
9.5' -
Homes near and along the North Platte River may flood, including homes along County Road 46 and County Road 199A. Flooding occurs along south side of Highway 26 from 5 miles upstream of Lewellen to Lewellen.
9' -
Moderate flood stage. Flooding may occur around Fairground Street, County Road 46, County Road 199 A and County Road 44 A east of Highway 26. Homes near and along the river may begin to flood.
8' -
Minor flood stage. Overflow and high water table levels may cause seepage and flooding of basements and crawl spaces near and along the river.
| Date | Stage (ft) |
|---|---|
| May 27, 2016 | 8.92 |
| Mar 3, 2019 | 8.74 |
| Jun 20, 2011 | 8.66 |
| Dec 18, 2003 | 8.65 |
| Dec 7, 2011 | 8.65 |
| Jun 2, 2015 | 8.64 |
| Dec 15, 1975 | 8.63 |
| Dec 17, 1974 | 8.57 |
| Dec 31, 2018 | 8.51 |
| Jun 25, 2010 | 8.41 |
| Mar 8, 1998 | 8.34 |
| Jun 6, 1997 | 8.28 |
| Jan 1, 1980 | 8.25 |
| Jan 31, 2014 | 8.2 |
| May 4, 2020 | 8.19 |
| Mar 5, 1995 | 8.11 |
| Dec 25, 2002 | 8.04 |
| Jun 7, 2017 | 8 |
| Dec 20, 1981 | 7.89 |
| Dec 3, 2006 | 7.84 |
Data provided by the National Weather Service.