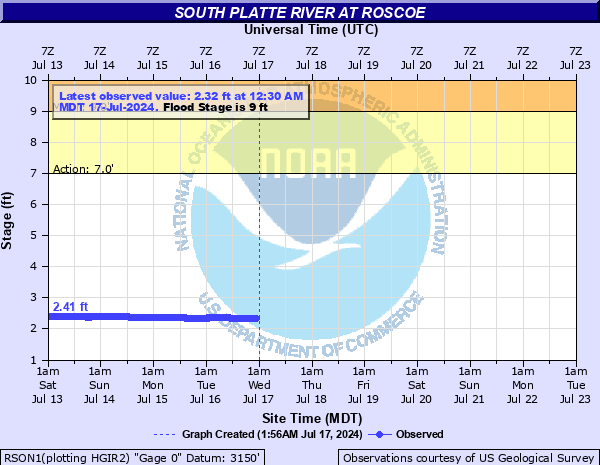
South Platte River at Roscoe
Critical Stages
7' - Action
9' - Flood
11' - Moderate
13' - Major
Latest Observation
Updated: 8:30 PM MST 12/15/25
Status: No Flooding
Stage: 3.34 ft
Flow: 0.198 kcfs
Forecast
Forecast not available for this location.
| Time | Stage (ft) | Flow (kcfs) |
|---|---|---|
| 8:30 PM 12/15 | 3.34 | 0.198 |
| 8:15 PM 12/15 | 3.34 | 0.198 |
| 8:00 PM 12/15 | 3.34 | 0.198 |
| 7:45 PM 12/15 | 3.33 | 0.193 |
| 7:30 PM 12/15 | 3.34 | 0.198 |
| 7:15 PM 12/15 | 3.34 | 0.198 |
| 7:00 PM 12/15 | 3.34 | 0.198 |
| 6:45 PM 12/15 | 3.34 | 0.198 |
| 6:30 PM 12/15 | 3.34 | 0.198 |
| 6:15 PM 12/15 | 3.34 | 0.198 |
| 6:00 PM 12/15 | 3.34 | 0.198 |
| 5:45 PM 12/15 | 3.34 | 0.198 |
| 5:30 PM 12/15 | 3.34 | 0.198 |
| 5:15 PM 12/15 | 3.35 | 0.202 |
| 5:00 PM 12/15 | 3.34 | 0.198 |
| 4:45 PM 12/15 | 3.34 | 0.198 |
| 4:30 PM 12/15 | 3.34 | 0.198 |
| 4:15 PM 12/15 | 3.34 | 0.198 |
| 4:00 PM 12/15 | 3.34 | 0.198 |
| 3:45 PM 12/15 | 3.35 | 0.202 |
| 3:30 PM 12/15 | 3.35 | 0.202 |
| 3:15 PM 12/15 | 3.35 | 0.202 |
| 3:00 PM 12/15 | 3.36 | 0.206 |
| 2:45 PM 12/15 | 3.36 | 0.206 |
| 2:30 PM 12/15 | 3.36 | 0.206 |
| 2:15 PM 12/15 | 3.36 | 0.206 |
| 2:00 PM 12/15 | 3.36 | 0.206 |
| 1:45 PM 12/15 | 3.36 | 0.206 |
| 1:30 PM 12/15 | 3.36 | 0.206 |
| 1:15 PM 12/15 | 3.35 | 0.202 |
15' -
Water reaches the low steel on the bridge between Intersate 80 to Roscoe.
13' -
Major flood stage. Widespread flooding between Interstate 80 and the railroad tracks along Highway 30. Water may cover the Interstate 80 exchange.
12' -
Water may cover Link 51 B which is the road between Interstate 80 and Roscoe on the south side of the river and north of the Interstate. On the north side of the river extensive flooding of agricultural land.
11' -
Moderate flood stage. Homes and out buildings along the river may flood. Flooding occurs along the river between Roscoe and the Interstate 80 exchange. Water may approach Link 51 B which is the road between Interstate 80 and Roscoe on the south side of the river.
10' -
Water reaches the gage house floor.
9' -
Flood Stage. Minor flooding of agricultural land along the river.
| Date | Stage (ft) |
|---|---|
| Sep 21, 2013 | 12.21 |
| Jun 6, 1995 | 11.29 |
| May 16, 2015 | 11.09 |
| May 7, 1999 | 10.69 |
| Jun 19, 2015 | 10.48 |
| Jun 23, 2010 | 10.2 |
| Jul 6, 2002 | 9.74 |
| Feb 6, 2016 | 9.69 |
| Jun 16, 1997 | 9.39 |
| Jul 2, 1983 | 9.31 |
| Jun 28, 2023 | 9.24 |
| Jun 10, 2014 | 9.22 |
| Jul 22, 2011 | 8.85 |
| Jun 15, 1986 | 8.24 |
| May 21, 1984 | 8.08 |
| Feb 25, 1989 | 8.02 |
| May 4, 2016 | 7.68 |
| Jun 13, 2009 | 7.47 |
| Jun 1, 1987 | 7.47 |
| Jun 1, 2017 | 7.02 |
Data provided by the National Weather Service.