Oconee River below Oconee
Critical Stages
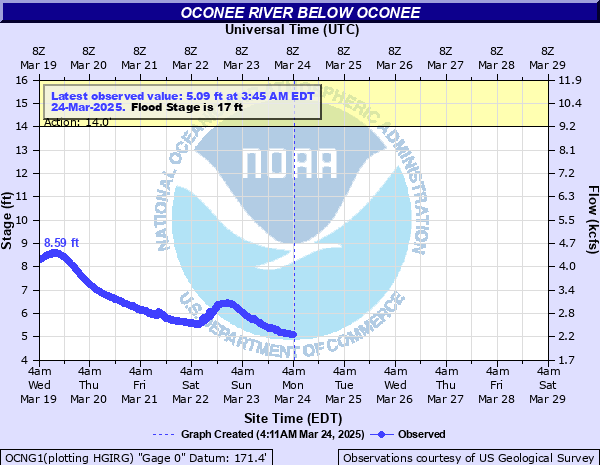
14' - Action
17' - Flood
21' - Moderate
25' - Major
Latest Observation
Updated: 4:45 PM EST 12/15/25
Status: No Flooding
Stage: 2.15 ft
Flow: 0.823 kcfs
Forecast
Forecast not available for this location.
| Time | Stage (ft) | Flow (kcfs) |
|---|---|---|
| 4:45 PM 12/15 | 2.15 | 0.823 |
| 4:30 PM 12/15 | 2.15 | 0.823 |
| 4:15 PM 12/15 | 2.16 | 0.828 |
| 4:00 PM 12/15 | 2.15 | 0.823 |
| 3:45 PM 12/15 | 2.15 | 0.823 |
| 3:30 PM 12/15 | 2.15 | 0.823 |
| 3:15 PM 12/15 | 2.16 | 0.828 |
| 3:00 PM 12/15 | 2.16 | 0.828 |
| 2:45 PM 12/15 | 2.15 | 0.823 |
| 2:30 PM 12/15 | 2.16 | 0.828 |
| 2:15 PM 12/15 | 2.16 | 0.828 |
| 2:00 PM 12/15 | 2.16 | 0.828 |
| 1:45 PM 12/15 | 2.16 | 0.828 |
| 1:30 PM 12/15 | 2.16 | 0.828 |
| 1:15 PM 12/15 | 2.16 | 0.828 |
| 1:00 PM 12/15 | 2.17 | 0.832 |
| 12:45 PM 12/15 | 2.16 | 0.828 |
| 12:30 PM 12/15 | 2.16 | 0.828 |
| 12:15 PM 12/15 | 2.16 | 0.828 |
| 12:00 PM 12/15 | 2.16 | 0.828 |
| 11:45 AM 12/15 | 2.17 | 0.832 |
| 11:30 AM 12/15 | 2.17 | 0.832 |
| 11:15 AM 12/15 | 2.18 | 0.836 |
| 11:00 AM 12/15 | 2.17 | 0.832 |
| 10:45 AM 12/15 | 2.18 | 0.836 |
| 10:30 AM 12/15 | 2.18 | 0.836 |
| 10:15 AM 12/15 | 2.17 | 0.832 |
| 10:00 AM 12/15 | 2.18 | 0.836 |
| 9:45 AM 12/15 | 2.17 | 0.832 |
| 9:30 AM 12/15 | 2.17 | 0.832 |
29' -
Near record flooding occurs with widespread inundation of the woodlands along the river. Some areas will be up to 10 feet under water. Old Balls Ferry Road north of Georgia Highway 57 will be under 3 to 7 feet of water. The water level will be around 4 feet deep in the USGS gage house near the boat ramp. This will likely cause a loss of data transmission.
27' -
Major flooding continues. Most of Old Balls Ferry Road north of Georgia Highway 57 will be under 3 to 5 feet of water. The water level will be around two feet deep in the USGS gage house near the boat ramp. This may affect data transmission. Widespread flooding up to several feet deep of the woodlands near the river occurs.
25' -
Major flooding occurs. Most of Old Balls Ferry Road north of Georgia Highway 57 will be under one to three feet of water. The water level reaches the bottom of the USGS gaging equipment near the boat ramp. Widespread flooding up to several feet deep of the woodlands near the river occurs.
23' -
Moderate flooding continues. Portions of the Old Balls Ferry Road leading to the boat ramp becomes flooded with a foot of water or more. The entire dirt parking lot near the boat ramp is under three to five feet of water. Extensive flooding of the woodlands near the river continues.
21' -
Moderate flooding begins. The dirt parking lot by the Old Balls Ferry Road boat ramp is under one to three feet of water. The end of Old Balls Ferry Road begins to flood. Flooding continues and spreads further into the woodlands near the river.
19' -
The water level begins to flood the dirt parking lot area near the Old Balls Ferry Road boat ramp...just upstream and rightbank from the Georgia Highway 57 bridge. Minor flooding continues and spreads further into the woodlands near the river.
18' -
The water level begins to flood portions of the dirt parking lot area near the Old Balls Ferry Road boat ramp...just upstream and rightbank from the Georgia Highway 57 bridge. Minor flooding continues in the woodlands near the river.
17' -
Flood stage is reached. The water level reaches the top of the Old Balls Ferry Road boat ramp...just upstream and rightbank from the Georgia Highway 57 bridge. Minor flooding of woodlands near the river occurs.
14' -
Bankfull conditions are reached along the river. The Old Balls Ferry Road boat ramp...just upstream and right bank from the Georgia Highway 57 bridge...will begin to flood.
| Date | Stage (ft) |
|---|---|
| Mar 10, 1998 | 29.9 |
| Dec 26, 2015 | 27.01 |
| Feb 9, 2020 | 26.39 |
| Feb 20, 1995 | 25.82 |
| Mar 29, 2023 | 25.55 |
| Apr 4, 2009 | 25.28 |
| Apr 9, 2022 | 24.84 |
| Feb 15, 2024 | 24.22 |
| Mar 9, 1996 | 24.02 |
| Feb 21, 2020 | 24 |
| Nov 14, 2009 | 23.76 |
| Mar 8, 2020 | 23.53 |
| Nov 28, 1992 | 23.32 |
| Sep 30, 2004 | 23.11 |
| Jan 7, 2019 | 23.1 |
| Jan 13, 2024 | 22.5 |
| Apr 4, 2016 | 22.49 |
| Oct 10, 2021 | 22.18 |
| Feb 9, 2010 | 21.24 |
| Dec 21, 2009 | 21.04 |
Data provided by the National Weather Service.