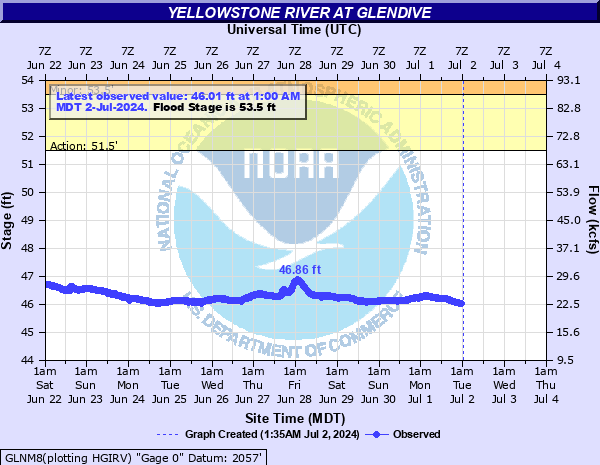
Yellowstone River at Glendive
Critical Stages
51.5' - Action
53.5' - Flood
60' - Moderate
65' - Major
Latest Observation
Updated: 12:45 AM MST 12/16/25
Status: No Flooding
Stage: 50.05 ft
Flow: 54.3 kcfs
Forecast
Forecast not available for this location.
| Time | Stage (ft) | Flow (kcfs) |
|---|---|---|
| 12:45 AM 12/16 | 50.05 | 54.3 |
| 12:30 AM 12/16 | 50.03 | 54.1 |
| 12:15 AM 12/16 | 50.03 | 54.1 |
| 12:00 AM 12/16 | 50.02 | 54.1 |
| 11:45 PM 12/15 | 50.02 | 54.1 |
| 11:30 PM 12/15 | 50.05 | 54.3 |
| 11:15 PM 12/15 | 50.06 | 54.4 |
| 11:00 PM 12/15 | 50.06 | 54.4 |
| 10:45 PM 12/15 | 50.07 | 54.5 |
| 10:30 PM 12/15 | 50.07 | 54.5 |
| 10:15 PM 12/15 | 50.08 | 54.6 |
| 10:00 PM 12/15 | 50.07 | 54.5 |
| 9:45 PM 12/15 | 49.98 | 53.7 |
| 9:30 PM 12/15 | 49.87 | 52.7 |
| 9:15 PM 12/15 | 49.73 | 51.5 |
| 9:00 PM 12/15 | 49.78 | 51.9 |
| 8:45 PM 12/15 | 49.77 | 51.8 |
| 8:30 PM 12/15 | 49.75 | 51.6 |
| 8:15 PM 12/15 | 49.71 | 51.3 |
| 8:00 PM 12/15 | 49.69 | 51.1 |
| 7:45 PM 12/15 | 49.67 | 50.9 |
| 7:30 PM 12/15 | 49.64 | 50.7 |
| 7:15 PM 12/15 | 49.59 | 50.2 |
| 7:00 PM 12/15 | 49.57 | 50 |
| 6:45 PM 12/15 | 49.56 | 50 |
| 6:30 PM 12/15 | 49.59 | 50.2 |
| 6:15 PM 12/15 | 49.62 | 50.5 |
| 6:00 PM 12/15 | 49.62 | 50.5 |
| 5:45 PM 12/15 | 49.63 | 50.6 |
| 5:30 PM 12/15 | 49.59 | 50.2 |
67' -
Much of downtown Glendive will be flooded.
66' -
This is the flood of record due to ice jam.
65' -
West Glendive levee will be overtopped flooding most of West Glendive. Interstate 94 will flood at milepost 214 between the Montana 16 exit and the Yellowstone River.
60.5' -
Marsh Road on the south end of Glendive will flood. Riverview Trailer Park will start to flood.
54' -
Toepke Park on the east side of the river begins to flood.
53.65' -
Minor flooding begins at 53.65 feet in a reach 5 miles above and below Glendive.
53.5' -
This is flood stage.
51.5' -
Low-land flooding will affect some ranches along the Yellowstone River.
| Date | Stage (ft) |
|---|---|
| Mar 15, 1920 | 66 |
| Mar 20, 1969 | 62.8 |
| Mar 21, 1978 | 62.3 |
| Feb 16, 1971 | 61.25 |
| Mar 5, 1994 | 60.5 |
| Mar 19, 1959 | 60.5 |
| Mar 17, 2003 | 60.49 |
| Feb 21, 1982 | 60.05 |
| Mar 10, 2014 | 59.35 |
| Mar 23, 2018 | 59.07 |
| Mar 17, 1979 | 56.55 |
| May 23, 2011 | 56.38 |
| Mar 11, 2011 | 55.85 |
| Mar 12, 1972 | 55.6 |
| Feb 26, 2025 | 55.15 |
| Mar 22, 2019 | 54.95 |
| Jun 9, 1909 | 54.3 |
| May 22, 1978 | 53.85 |
| Jul 7, 1909 | 53.6 |
| Mar 3, 2020 | 53.5 |
Data provided by the National Weather Service.