« Back to Lake Manawa State Park Rivers
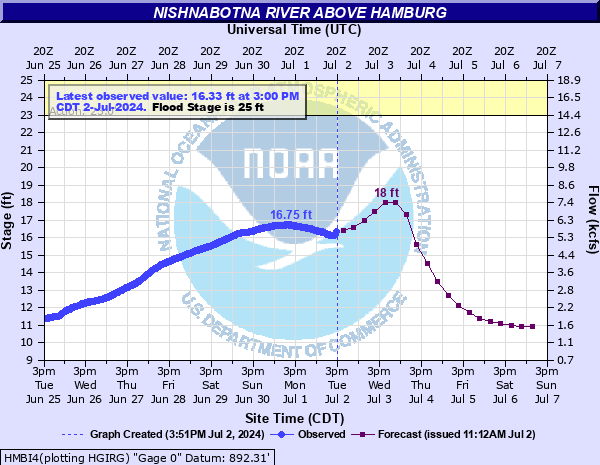
Nishnabotna River above Hamburg
Critical Stages
23' - Action
25' - Flood
27.5' - Moderate
33' - Major
Latest Observation
Updated: 9:00 AM CST 12/6/25
Status: No Flooding
Stage: 10.12 ft
Flow: 1.23 kcfs
Forecast
Forecast not available for this location.
| Time | Stage (ft) | Flow (kcfs) |
|---|---|---|
| 9:00 AM 12/6 | 10.12 | 1.23 |
| 8:45 AM 12/6 | 10.13 | 1.24 |
| 8:30 AM 12/6 | 10.13 | 1.24 |
| 8:15 AM 12/6 | 10.14 | 1.24 |
| 8:00 AM 12/6 | 10.13 | 1.24 |
| 7:45 AM 12/6 | 10.14 | 1.24 |
| 7:30 AM 12/6 | 10.15 | 1.25 |
| 7:15 AM 12/6 | 10.15 | 1.25 |
| 7:00 AM 12/6 | 10.14 | 1.24 |
| 6:45 AM 12/6 | 10.15 | 1.25 |
| 6:30 AM 12/6 | 10.16 | 1.25 |
| 6:15 AM 12/6 | 10.16 | 1.25 |
| 6:00 AM 12/6 | 10.17 | 1.26 |
| 5:45 AM 12/6 | 10.16 | 1.25 |
| 5:30 AM 12/6 | 10.16 | 1.25 |
| 5:15 AM 12/6 | 10.17 | 1.26 |
| 5:00 AM 12/6 | 10.17 | 1.26 |
| 4:45 AM 12/6 | 10.18 | 1.26 |
| 4:30 AM 12/6 | 10.18 | 1.26 |
| 4:15 AM 12/6 | 10.18 | 1.26 |
| 4:00 AM 12/6 | 10.19 | 1.27 |
| 3:45 AM 12/6 | 10.19 | 1.27 |
| 3:30 AM 12/6 | 10.2 | 1.27 |
| 3:15 AM 12/6 | 10.19 | 1.27 |
| 3:00 AM 12/6 | 10.2 | 1.27 |
| 2:45 AM 12/6 | 10.2 | 1.27 |
| 2:30 AM 12/6 | 10.2 | 1.27 |
| 2:15 AM 12/6 | 10.21 | 1.28 |
| 2:00 AM 12/6 | 10.21 | 1.28 |
| 1:45 AM 12/6 | 10.21 | 1.28 |
39' -
Water reaches the bottom of the J64 bridge at the gage site.
33' -
The top of the levee near the bridge in town is overtopped with flood waters. I-29 is closed south of town.
27.5' -
State Highway 275 south of the gage may be threatened in several spots.
25' -
More extensive lowland flooding begins as the parking lot near the gauge begins to experience flooding. In addition, some local farm levees may be overtopped with flood waters.
23' -
Minor overflows begin within the city limits, however there is no threat to property at this stage.
| Date | Stage (ft) |
|---|---|
| Jun 17, 1998 | 33.18 |
| May 8, 2007 | 32.44 |
| Mar 16, 2019 | 31.07 |
| Jul 25, 1993 | 30.56 |
| Jun 14, 2008 | 29.19 |
| Aug 8, 1999 | 28.83 |
| Jun 22, 1996 | 28.45 |
| Sep 10, 1989 | 28.27 |
| May 27, 1987 | 28.14 |
| Jul 27, 1990 | 28.06 |
| May 26, 2004 | 28.04 |
| Jun 16, 1984 | 27.9 |
| Mar 7, 1979 | 27.46 |
| Sep 15, 1972 | 27.42 |
| Dec 15, 2015 | 27.27 |
| Jun 15, 1982 | 27.25 |
| Jun 14, 2010 | 26.95 |
| Jun 15, 1991 | 26.75 |
| Jun 4, 2014 | 26.57 |
| Feb 20, 1971 | 26.03 |
Data provided by the National Weather Service.