« Back to Lake Manawa State Park Rivers
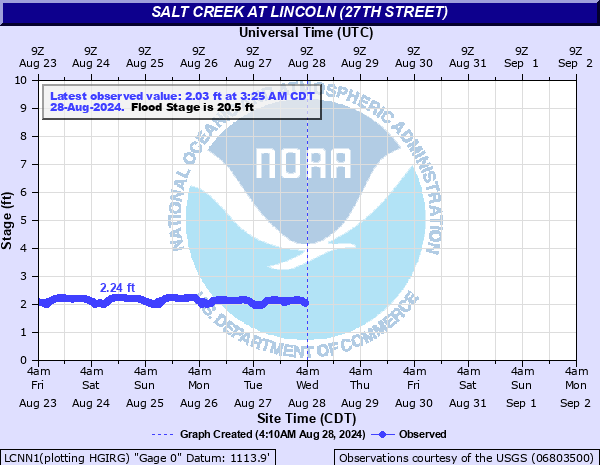
Salt Creek at Lincoln (27th Street)
Critical Stages
14' - Action
20.5' - Flood
26.5' - Moderate
29' - Major
Latest Observation
Updated: 9:25 AM CST 12/6/25
Status: No Flooding
Stage: 2.07 ft
Flow: 0.0578 kcfs
Forecast
Forecast not available for this location.
| Time | Stage (ft) | Flow (kcfs) |
|---|---|---|
| 9:25 AM 12/6 | 2.07 | 0.0578 |
| 9:20 AM 12/6 | 2.07 | 0.0578 |
| 9:15 AM 12/6 | 2.07 | 0.0578 |
| 9:10 AM 12/6 | 2.06 | 0.0561 |
| 9:05 AM 12/6 | 2.07 | 0.0578 |
| 9:00 AM 12/6 | 2.08 | 0.0595 |
| 8:55 AM 12/6 | 2.08 | 0.0595 |
| 8:50 AM 12/6 | 2.08 | 0.0595 |
| 8:45 AM 12/6 | 2.09 | 0.0612 |
| 8:40 AM 12/6 | 2.09 | 0.0612 |
| 8:35 AM 12/6 | 2.09 | 0.0612 |
| 8:30 AM 12/6 | 2.09 | 0.0612 |
| 8:25 AM 12/6 | 2.09 | 0.0612 |
| 8:20 AM 12/6 | 2.09 | 0.0612 |
| 8:15 AM 12/6 | 2.09 | 0.0612 |
| 8:10 AM 12/6 | 2.09 | 0.0612 |
| 8:05 AM 12/6 | 2.09 | 0.0612 |
| 8:00 AM 12/6 | 2.09 | 0.0612 |
| 7:55 AM 12/6 | 2.08 | 0.0595 |
| 7:50 AM 12/6 | 2.07 | 0.0578 |
| 7:45 AM 12/6 | 2.06 | 0.0561 |
| 7:40 AM 12/6 | 2.06 | 0.0561 |
| 7:35 AM 12/6 | 2.07 | 0.0578 |
| 7:30 AM 12/6 | 2.07 | 0.0578 |
| 7:25 AM 12/6 | 2.07 | 0.0578 |
| 7:20 AM 12/6 | 2.08 | 0.0595 |
| 7:15 AM 12/6 | 2.08 | 0.0595 |
| 7:10 AM 12/6 | 2.09 | 0.0612 |
| 7:05 AM 12/6 | 2.09 | 0.0612 |
| 7:00 AM 12/6 | 2.09 | 0.0612 |
33' -
Water reaches the bottom of the 27th street bridge.
29' -
Major flooding is imminent, or ongoing, as levees may begin to be overtopped all along Salt Creek. At this level the water is near the level observed in May of 2015 when areas like Nebraska Innovation Campus flooded and levees were at capacity.
26.5' -
Areas of the North Bottoms begin to flood as does the area around, and including, the baseball field at Haymarket Park.
23' -
Lower areas between Capitol Beach and Interstate 80 flood, this includes commerical areas west of Sun Valley Boulevard and north of West O Street. Capitol Beach itself may see flooding along the east side closer to the railroad tracks.
21' -
Flooding is contained to the channel at the gage site. Upstream of the gage site, southwest of North 14 Street, lowland flooding begins in areas between West O Street and Rosa Parks Way, including the railyard.
14' -
There is no flooding at this level. However, at this level local officials begin increased monitoring of Salt Creek as the creek is two-thirds bankfull.
| Date | Stage (ft) |
|---|---|
| May 7, 2015 | 28.87 |
| Jul 24, 1993 | 26.52 |
| Jun 2, 1951 | 26.15 |
| May 9, 1950 | 26.05 |
| Oct 11, 1973 | 23.8 |
| Jun 25, 1963 | 23.6 |
| Jul 10, 1958 | 23 |
| Sep 8, 1989 | 22.67 |
| Jun 15, 1982 | 21.9 |
| Mar 13, 2019 | 21.44 |
| May 6, 2007 | 21.04 |
| Oct 11, 1986 | 20.94 |
| Jun 13, 1984 | 20.92 |
| Oct 1, 2014 | 20.51 |
| Jul 26, 1990 | 20.43 |
| Mar 23, 1987 | 20.41 |
| Jul 1, 1957 | 19.43 |
| Jul 19, 1985 | 19.1 |
| Jun 29, 1965 | 19.03 |
| Jun 17, 1964 | 19.02 |
Data provided by the National Weather Service.