« Back to Lake Manawa State Park Rivers
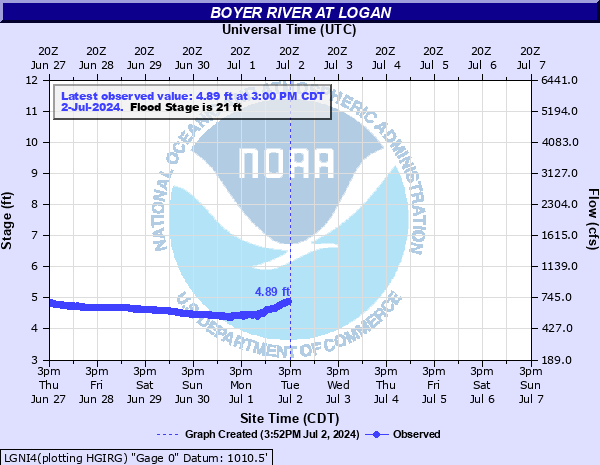
Boyer River at Logan
Critical Stages
19' - Action
21' - Flood
22' - Moderate
25' - Major
Latest Observation
Updated: 9:00 AM CST 12/6/25
Status: No Flooding
Stage: 4.87 ft
Flow: 0.335 kcfs
Forecast
Forecast not available for this location.
| Time | Stage (ft) | Flow (kcfs) |
|---|---|---|
| 9:00 AM 12/6 | 4.87 | 0.335 |
| 8:45 AM 12/6 | 4.87 | 0.335 |
| 8:30 AM 12/6 | 4.88 | 0.339 |
| 8:15 AM 12/6 | 4.88 | 0.339 |
| 8:00 AM 12/6 | 4.87 | 0.335 |
| 7:45 AM 12/6 | 4.87 | 0.335 |
| 7:30 AM 12/6 | 4.87 | 0.335 |
| 7:15 AM 12/6 | 4.87 | 0.335 |
| 7:00 AM 12/6 | 4.87 | 0.335 |
| 6:45 AM 12/6 | 4.87 | 0.335 |
| 6:30 AM 12/6 | 4.86 | 0.332 |
| 6:15 AM 12/6 | 4.86 | 0.332 |
| 6:00 AM 12/6 | 4.85 | 0.329 |
| 5:45 AM 12/6 | 4.85 | 0.329 |
| 5:30 AM 12/6 | 4.84 | 0.326 |
| 5:15 AM 12/6 | 4.84 | 0.326 |
| 5:00 AM 12/6 | 4.84 | 0.326 |
| 4:45 AM 12/6 | 4.83 | 0.323 |
| 4:30 AM 12/6 | 4.82 | 0.32 |
| 4:15 AM 12/6 | 4.82 | 0.32 |
| 4:00 AM 12/6 | 4.82 | 0.32 |
| 3:45 AM 12/6 | 4.82 | 0.32 |
| 3:30 AM 12/6 | 4.81 | 0.317 |
| 3:15 AM 12/6 | 4.82 | 0.32 |
| 3:00 AM 12/6 | 4.82 | 0.32 |
| 2:45 AM 12/6 | 4.82 | 0.32 |
| 2:30 AM 12/6 | 4.82 | 0.32 |
| 2:15 AM 12/6 | 4.83 | 0.323 |
| 2:00 AM 12/6 | 4.84 | 0.326 |
| 1:45 AM 12/6 | 4.84 | 0.326 |
25' -
Widespread flooding is occurring in areas upstream and downstream of Logan, likely impacting portions of Woodbine and Missouri Valley. Logan itself is largely unaffected except for areas right along the river from 6th Avenue down through 11th Street. Also at this level the railroad bridge east of town begins to be impacted.
22' -
Highway 30 will flood in a few low spots between Missouri Valley and Logan.
21' -
The ballfields north of town are flooded.
20.5' -
Buildings along the west bank of the river, south of 8th street but west of the railroad tracks, begin to flood.
19' -
There is considerable overbank flooding upstream of Logan with downstream overbank flooding also occurring but less substantial. Floodwater may begin to encroach on the ballfields north of town may begin to be impacted.
| Date | Stage (ft) |
|---|---|
| Mar 13, 2019 | 25.33 |
| Mar 1, 1965 | 25.22 |
| Jun 8, 2008 | 24.75 |
| Jul 17, 1996 | 23.87 |
| Jun 21, 1996 | 23.02 |
| Jun 16, 1957 | 22.67 |
| Feb 19, 1971 | 22.65 |
| Jun 17, 1990 | 22.54 |
| Mar 18, 1979 | 22.47 |
| Jul 9, 1993 | 22.19 |
| Sep 1, 2014 | 21.94 |
| Sep 11, 1972 | 21.76 |
| Sep 13, 1978 | 21.73 |
| May 6, 2007 | 21.53 |
| Feb 18, 1997 | 21.07 |
| Jun 15, 1991 | 20.76 |
| Sep 26, 1973 | 20.32 |
| May 19, 1974 | 20.21 |
| Dec 14, 2015 | 20.15 |
| Jun 18, 1950 | 20.01 |
Data provided by the National Weather Service.