« Back to Lake Manawa State Park Rivers
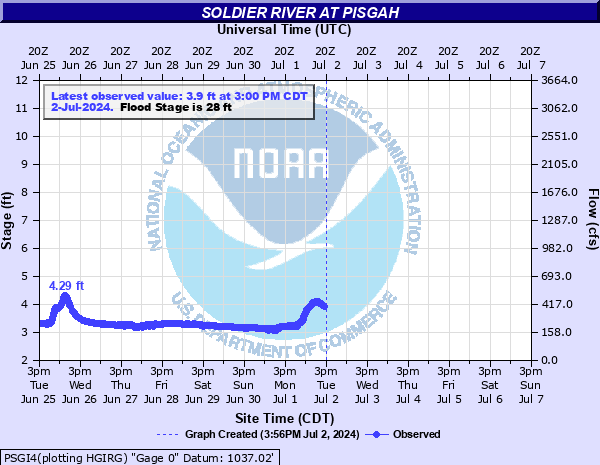
Soldier River at Pisgah
Critical Stages
26' - Action
28' - Flood
29' - Moderate
30' - Major
Latest Observation
Updated: 6:09 PM LMT 12/31/00
Status: Obs Not Current
Stage: -999 ft
Flow: -999 kcfs
Forecast
Forecast not available for this location.
| Time | Stage (ft) | Flow (kcfs) |
|---|---|---|
| 10:00 AM 12/5 | 2.97 | 0.155 |
| 9:45 AM 12/5 | 2.95 | 0.152 |
| 9:30 AM 12/5 | 2.95 | 0.152 |
| 9:15 AM 12/5 | 2.93 | 0.148 |
| 9:00 AM 12/5 | 2.91 | 0.145 |
| 8:45 AM 12/5 | 2.9 | 0.143 |
| 8:30 AM 12/5 | 2.88 | 0.139 |
| 8:15 AM 12/5 | 2.86 | 0.135 |
| 8:00 AM 12/5 | 2.84 | 0.131 |
| 7:45 AM 12/5 | 2.83 | 0.129 |
| 7:30 AM 12/5 | 2.82 | 0.128 |
| 7:15 AM 12/5 | 2.81 | 0.126 |
| 7:00 AM 12/5 | 2.8 | 0.124 |
| 6:45 AM 12/5 | 2.79 | 0.115 |
| 6:30 AM 12/5 | 2.78 | 0.106 |
| 6:15 AM 12/5 | 2.77 | 0.104 |
| 6:00 AM 12/5 | 2.76 | 0.103 |
| 5:45 AM 12/5 | 2.74 | 0.0997 |
| 5:30 AM 12/5 | 2.73 | 0.0982 |
| 5:15 AM 12/5 | 2.73 | 0.0982 |
| 5:00 AM 12/5 | 2.72 | 0.0967 |
| 4:45 AM 12/5 | 2.72 | 0.0967 |
| 4:30 AM 12/5 | 2.72 | 0.0967 |
| 4:15 AM 12/5 | 2.71 | 0.0952 |
| 4:00 AM 12/5 | 2.71 | 0.0952 |
| 3:45 AM 12/5 | 2.71 | 0.0952 |
| 3:30 AM 12/5 | 2.7 | 0.0938 |
| 3:15 AM 12/5 | 2.7 | 0.0938 |
| 3:00 AM 12/5 | 2.7 | 0.0938 |
| 2:45 AM 12/5 | 2.7 | 0.0938 |
35' -
Water reaches the bottom of the bridge at the gage site.
28' -
Considerable amounts of farmlands, pasture, and county roads flood.
27' -
The county road on the right bank may flood near the gage. A storage area for ammonia tanks floods on the outskirts of Moorhead which is 7 miles upstream of the gage site.
26' -
Water levels at the upper and middle reaches of the river (upstream of the gage) come out of the banks affecting pastures and some farmlands.
| Date | Stage (ft) |
|---|---|
| Jul 17, 1996 | 28.87 |
| Jun 12, 1950 | 28.2 |
| Jul 9, 1993 | 27.56 |
| Jun 17, 1951 | 27.46 |
| Mar 13, 2019 | 27.26 |
| May 6, 2007 | 26.64 |
| Jun 28, 1942 | 26.1 |
| Jun 4, 1940 | 25.7 |
| Sep 13, 1978 | 25.6 |
| Jun 27, 1952 | 25.18 |
| Jun 15, 1991 | 25.04 |
| Jun 12, 1944 | 25 |
| Jun 17, 1990 | 24.42 |
| Aug 31, 1977 | 23.85 |
| Feb 19, 1971 | 23.7 |
| Jun 19, 1954 | 23.35 |
| Sep 4, 1946 | 22.6 |
| Aug 30, 1962 | 22.4 |
| May 26, 1964 | 22.21 |
| Sep 1, 2014 | 22.17 |
Data provided by the National Weather Service.