« Back to Lake Michigan Beach Rivers
St. Joseph River (MI/IN) at Elkhart
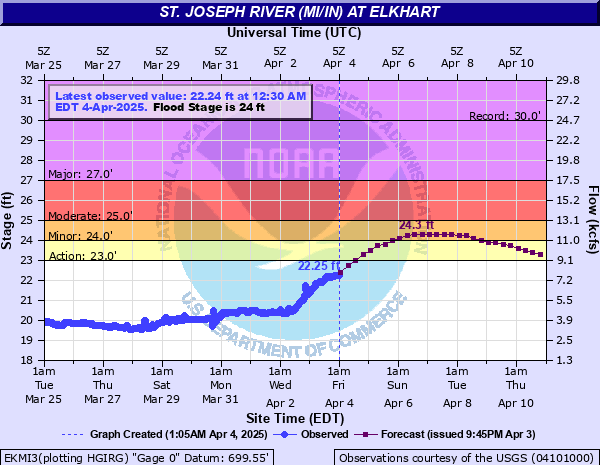
Critical Stages
23' - Action
24' - Flood
25' - Moderate
27' - Major
Latest Observation
Updated: 6:30 AM EST 12/6/25
Status: No Flooding
Stage: 18.24 ft
Flow: 1.1 kcfs
Forecast
Forecast not available for this location.
| Time | Stage (ft) | Flow (kcfs) |
|---|---|---|
| 6:30 AM 12/6 | 18.24 | 1.1 |
| 6:15 AM 12/6 | 18.24 | 1.1 |
| 6:00 AM 12/6 | 18.24 | 1.1 |
| 5:45 AM 12/6 | 18.25 | 1.11 |
| 5:30 AM 12/6 | 18.24 | 1.1 |
| 5:15 AM 12/6 | 18.24 | 1.1 |
| 5:00 AM 12/6 | 18.25 | 1.11 |
| 4:45 AM 12/6 | 18.24 | 1.1 |
| 4:30 AM 12/6 | 18.24 | 1.1 |
| 4:15 AM 12/6 | 18.24 | 1.1 |
| 4:00 AM 12/6 | 18.24 | 1.1 |
| 3:45 AM 12/6 | 18.24 | 1.1 |
| 3:30 AM 12/6 | 18.24 | 1.1 |
| 3:15 AM 12/6 | 18.24 | 1.1 |
| 3:00 AM 12/6 | 18.24 | 1.1 |
| 2:45 AM 12/6 | 18.23 | 1.09 |
| 2:30 AM 12/6 | 18.22 | 1.08 |
| 2:15 AM 12/6 | 18.18 | 1.04 |
| 2:00 AM 12/6 | 18.16 | 1.01 |
| 1:45 AM 12/6 | 18.12 | 0.973 |
| 1:30 AM 12/6 | 18.09 | 0.941 |
| 1:15 AM 12/6 | 18.1 | 0.952 |
| 1:00 AM 12/6 | 18.1 | 0.952 |
| 12:45 AM 12/6 | 18.1 | 0.952 |
| 12:30 AM 12/6 | 18.1 | 0.952 |
| 12:15 AM 12/6 | 18.1 | 0.952 |
| 12:00 AM 12/6 | 18.1 | 0.952 |
| 11:45 PM 12/5 | 18.1 | 0.952 |
| 11:30 PM 12/5 | 18.1 | 0.952 |
| 11:15 PM 12/5 | 18.1 | 0.952 |
30.01' -
Extensive flooding occurs of commercial property along east Jackson Street. Flood water is 1 to 2 feet deep in some businesses with east Jackson Street nearly impassible.
30' -
Residential flooding from Second Street to and including South Shore Drive. Several city streets become impassible.
29' -
Extensive flooding of the commercial district along east Jackson Street is in progress.
28' -
Extensive street flooding is in progress.
27' -
Water begins to affect businesses on east Jackson Street. Flooding affects a few first floor residences in the South Shore Drive area across from the hospital.
25' -
Basement flooding begins in residential areas of the 6th Street area and along South Shore Drive.
24' -
Island park in Elkhart and Kamm's Island in Mishawaka begin to flood.
| Date | Stage (ft) |
|---|---|
| Mar 8, 1908 | 30 |
| May 6, 2019 | 23.96 |
| Feb 27, 2022 | 23.17 |
| Mar 7, 2023 | 23.03 |
| Apr 9, 2014 | 22.86 |
| Apr 5, 2014 | 22.86 |
| Apr 5, 2014 | 22.86 |
| Jul 23, 2015 | 22.4 |
| Apr 10, 2017 | 22.29 |
| Jul 2, 2021 | 22.22 |
Data provided by the National Weather Service.