« Back to Lake Michigan Beach Rivers
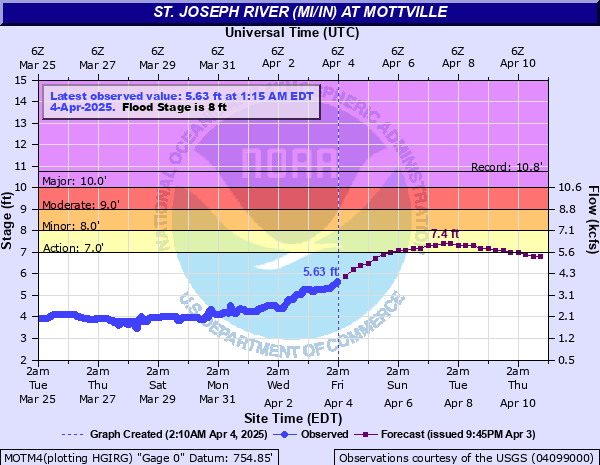
St. Joseph River (MI/IN) at Mottville
Critical Stages
7' - Action
8' - Flood
9' - Moderate
10' - Major
Latest Observation
Updated: 6:15 AM EST 12/6/25
Status: No Flooding
Stage: 2.68 ft
Flow: 0.926 kcfs
Forecast
Forecast not available for this location.
| Time | Stage (ft) | Flow (kcfs) |
|---|---|---|
| 7:15 AM 12/6 | 2.68 | 0.926 |
| 7:00 AM 12/6 | 2.68 | 0.926 |
| 6:45 AM 12/6 | 2.68 | 0.926 |
| 6:30 AM 12/6 | 2.68 | 0.926 |
| 6:15 AM 12/6 | 2.68 | 0.926 |
| 6:00 AM 12/6 | 2.68 | 0.926 |
| 5:45 AM 12/6 | 2.68 | 0.926 |
| 5:30 AM 12/6 | 2.68 | 0.926 |
| 5:15 AM 12/6 | 2.68 | 0.926 |
| 5:00 AM 12/6 | 2.67 | 0.919 |
| 4:45 AM 12/6 | 2.67 | 0.919 |
| 4:30 AM 12/6 | 2.67 | 0.919 |
| 4:15 AM 12/6 | 2.67 | 0.919 |
| 4:00 AM 12/6 | 2.67 | 0.919 |
| 3:45 AM 12/6 | 2.67 | 0.919 |
| 3:30 AM 12/6 | 2.66 | 0.912 |
| 3:15 AM 12/6 | 2.66 | 0.912 |
| 3:00 AM 12/6 | 2.64 | 0.898 |
| 2:45 AM 12/6 | 2.64 | 0.898 |
| 2:30 AM 12/6 | 2.64 | 0.898 |
| 2:15 AM 12/6 | 2.64 | 0.898 |
| 2:00 AM 12/6 | 2.64 | 0.898 |
| 1:45 AM 12/6 | 2.64 | 0.898 |
| 1:30 AM 12/6 | 2.64 | 0.898 |
| 1:15 AM 12/6 | 2.64 | 0.898 |
| 1:00 AM 12/6 | 2.64 | 0.898 |
| 12:45 AM 12/6 | 2.64 | 0.898 |
| 12:30 AM 12/6 | 2.64 | 0.898 |
| 12:15 AM 12/6 | 2.64 | 0.898 |
| 12:00 AM 12/6 | 2.64 | 0.898 |
10' -
A major flood is in progress. Expect extensive inundation and damage. Many primary roads and bridges will be closed and many people evacuated.
9' -
Moderate flooding of businesses and residences will occur in the village of Constantine.
8' -
Minor flooding of farmland and secondary roads will occur in low lying areas adjacent to the river.
6' -
Minor flooding of lowland adjacent to the river can be expected.
| Date | Stage (ft) |
|---|---|
| Apr 27, 1950 | 10.76 |
| Jun 4, 1989 | 10.41 |
| Feb 24, 2018 | 10.17 |
| Mar 21, 1982 | 9.81 |
| Feb 28, 1985 | 9.57 |
| May 20, 2020 | 8.62 |
| Jan 12, 2008 | 8.59 |
| Mar 13, 2009 | 8.58 |
| Mar 8, 1976 | 8.28 |
| Feb 1, 1969 | 8 |
| Apr 23, 2013 | 7.61 |
| Feb 19, 2005 | 7.16 |
| Mar 24, 2014 | 7.15 |
| Jan 12, 1998 | 7.07 |
| May 15, 2002 | 6.98 |
| Apr 11, 2017 | 6.92 |
| May 10, 2019 | 6.86 |
| Jun 1, 2011 | 6.76 |
| Apr 5, 2023 | 6.67 |
| Jun 18, 2004 | 6.46 |
Data provided by the National Weather Service.